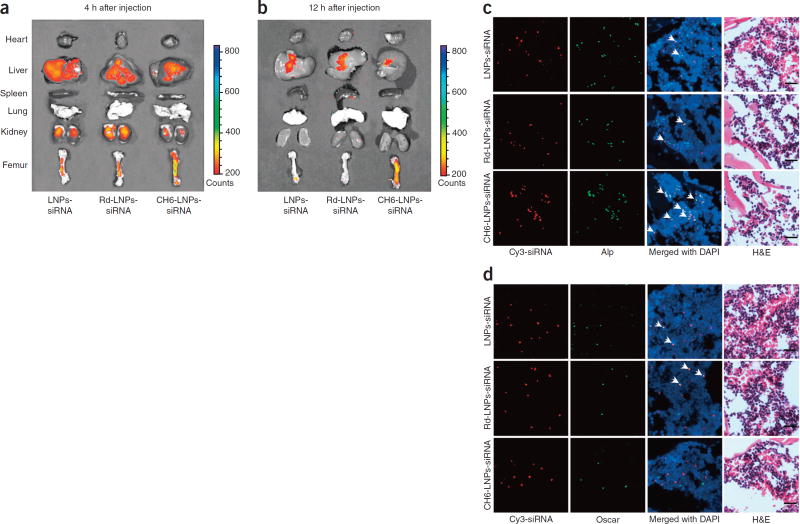
Figure 3.
Tissue distribution and cell-selective delivery of various siRNA formulations in vivo. (a,b) Tissue distribution: localization of Cy3-labeled siRNA in rats administered LNPs-siRNA, Rd-LNPs-siRNA or CH6-LNPs-siRNA, visualized by biophotonic imaging at 4 h (a) and 12 h (b). The intensities of the fluorescence signals in the isolated hearts, livers, spleens, lungs, kidneys and femurs are presented. Green, highest siRNA fluorescence intensity. (c,d) Cellular selectivity of siRNA in bone: fluorescence micrographs of cryosections from distal femur after injection of LNPs-siRNA (top row), Rd-LNPs-siRNA (middle row) or CH6-LNPs-siRNA (bottom row). The siRNA was labeled with Cy3 (red; left column). Immunofluorescence staining was performed to detect Alp+ osteoblasts (green; middle left column in c) and Oscar+ pre-osteoclasts/osteoclasts (green; middle left column in d). Merged images with DAPI staining show co-localization of siRNA with osteoblasts (Alp+ cells, arrows and yellow color, middle right column in c) or pre-osteoclasts/osteoclasts (Oscar+ cells, arrows and yellow color, middle right column in d). H&E staining of the same sections is included at right. Scale bars, 20 µm.

