Figure 4.
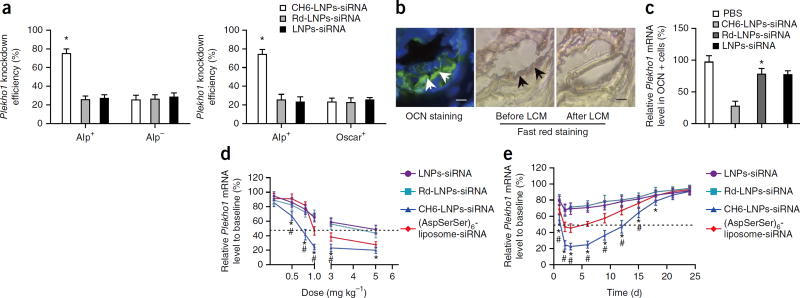
Cell-selective gene knockdown efficiency, dose-response pattern and persistence of gene silencing in vivo. (a) The knockdown efficiencies of Plekho1 mRNA in Alp+, Alp−, and Oscar+ cells after the administration of LNPs-siRNA, Rd-LNPs-siRNA, or CH6-LNPs-siRNA, as detected by FACS in combination with real-time PCR. (b) Osteoblasts are identified by OCN staining (arrows) in cryosections from the distal femurs (left). The adjacent sections are indicated by fast red staining before (middle) and after (right) LCM. Scale bars, 50 µm. (c) Real-time PCR was used to analyze the Plekho1 mRNA expression (relative to baseline) in OCN+ cells of rats injected with the specified siRNA formulation. PBS, control. (d) Plekho1 mRNA level (measured by real-time PCR) after a tail vein injection of LNPs-siRNA or Rd-LNPs-siRNA or CH6-LNPs-siRNA or (AspSerSer)6-liposome-siRNA at doses ranging from 0.1 to 5.0 mg kg−1. (e) Plekho1 mRNA level measured by real-time PCR after a single injection of the indicated siRNA formulations at a single dose of 1.0 mg kg−1. Dashed line, 50% Plekho1 mRNA level relative to baseline. Data in a,c–e are presented as means ± sd; n = 6 per group. *P < 0.05 for a comparison of CH6-LNPs-siRNA with LNPs-siRNA or Rd-LNPs-siRNA; #P < 0.05 for a comparison of CH6-LNPs-siRNA with (AspSerSer)6-liposome-siRNA. One-way ANOVA with LSD’s post hoc test was performed to determine inter-group differences.

