
Figure 3. Global analysis of in vivo DMS-MaPseq data.
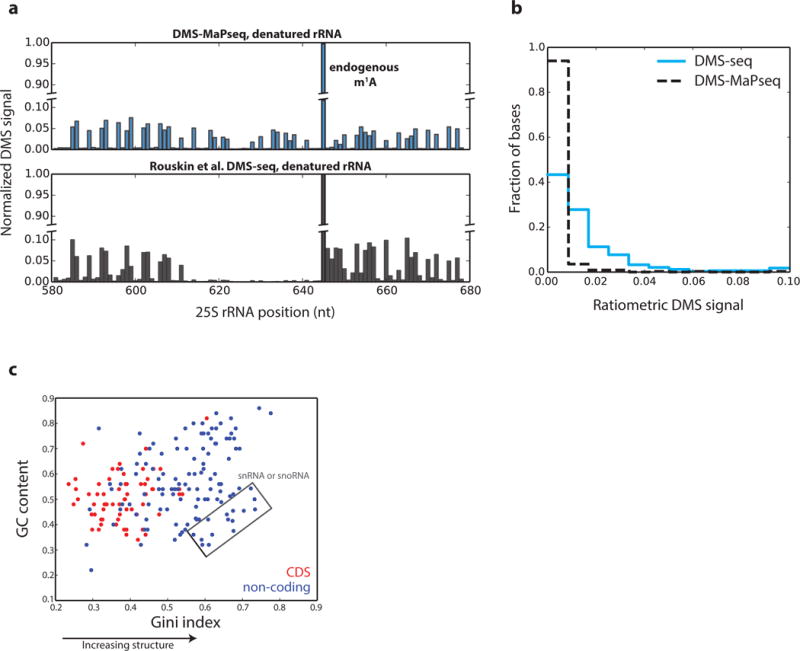
a, Signal decay observed after endogenous m1A modification at position 642 in the yeast 25S rRNA in DMS-seq, but not in DMS-MaPseq. b, Histogram of ratiometric reactivity for negative control bases in the yeast 18S rRNA. The total number of negative control bases is 338, characterized as bases known to be base-paired. c, Scatterplot of GC content versus Gini Index in 50nt windows of deeply sequenced genes. Non-coding RNA regions include UTRs and all classes of mammalian non-coding RNAs. The total number of evaluated windows is 182. Pearson’s correlation = 0.32, p-value = 7.3e-6.