
Figure 5. Novel experimental applications for in vivo RNA structure probing.
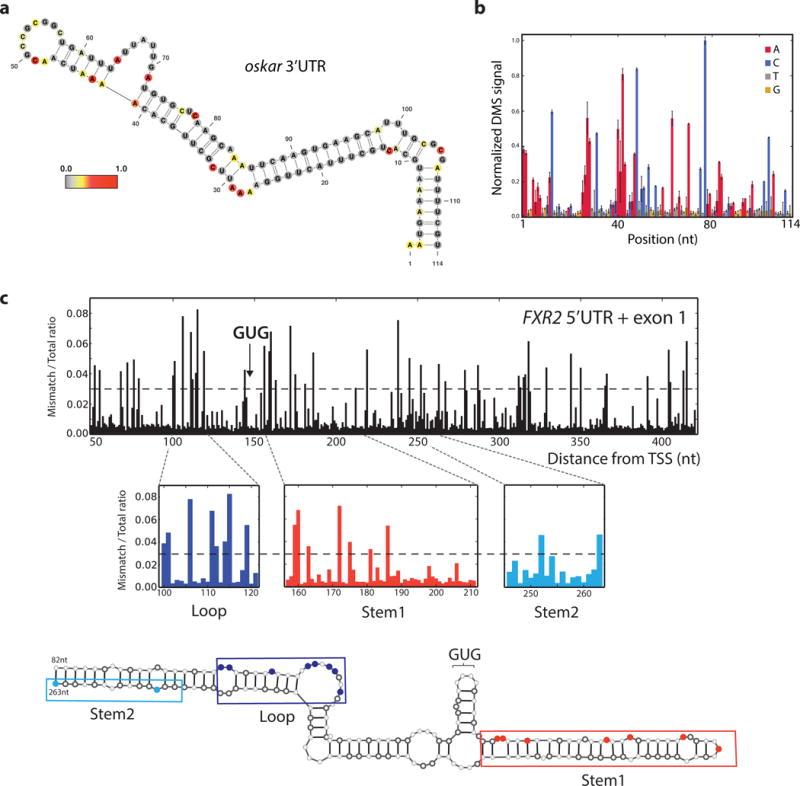
a, oskar 3′ UTR mRNA positive control structure from target-specific priming with nucleotides colored by in vivo DMS reactivity in D. melanogaster ovaries. DMS reactivity calculated as the ratiometric DMS signal per position normalized to the highest number of reads in displayed region, which is set to 1.0. b, oskar positive control region from (a) shown with average normalized DMS-MaPseq values from two biological replicates, one at 5 min DMS treatment and one at 10 min. Error bars represent one standard deviation. c, Ratiometric DMS-MaPseq from targeted amplification of the human FXR2 5′ UTR and exon1 sequence. Nucleotides accessible to DMS are noted with a value >0.03, which is the threshold representing the best agreement with our model. Position 1 corresponds to chromosome XVII:7614897.