
Figure 6. Investigating RNA structure heterogeneity with DMS-MaPseq.
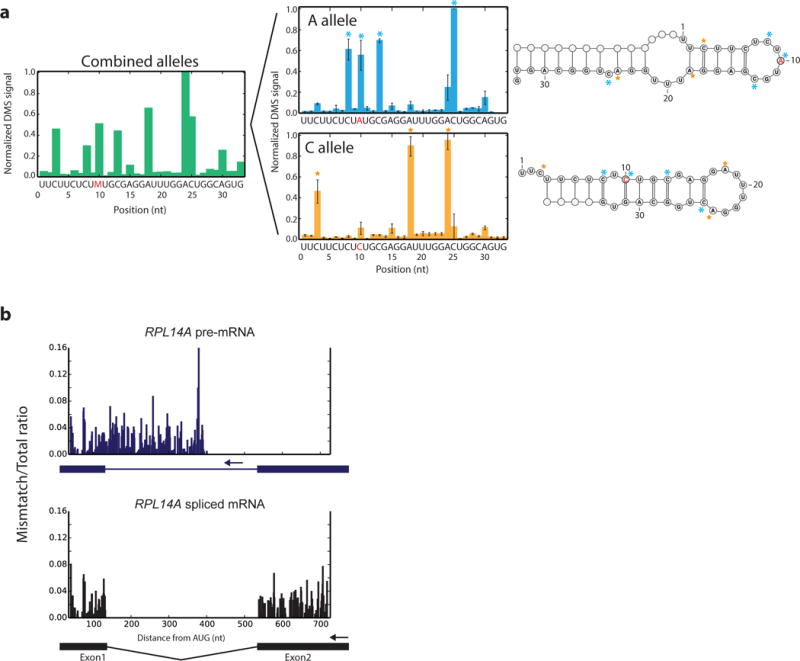
a, Regions of heterogeneous structure exhibit indistinguishable structure signals when combined but can be distinguished by DMS-MaPseq, illustrated by normalized DMS-MaPseq data derived from the human MRPS21 ribosnitch A/C alleles. Allele-specific data represented as the mean of three technical replicates. Error bars represent one standard deviation. b, Targeted DMS-MaPseq data specific for the yeast RPL14A pre-mRNA and spliced mRNA isoforms reveal minimal structure difference in the common exon1 sequence (r = 0.88). Ratiometric in vivo DMS-MaPseq data is plotted with isoform-specific RT primer locations noted with arrows.