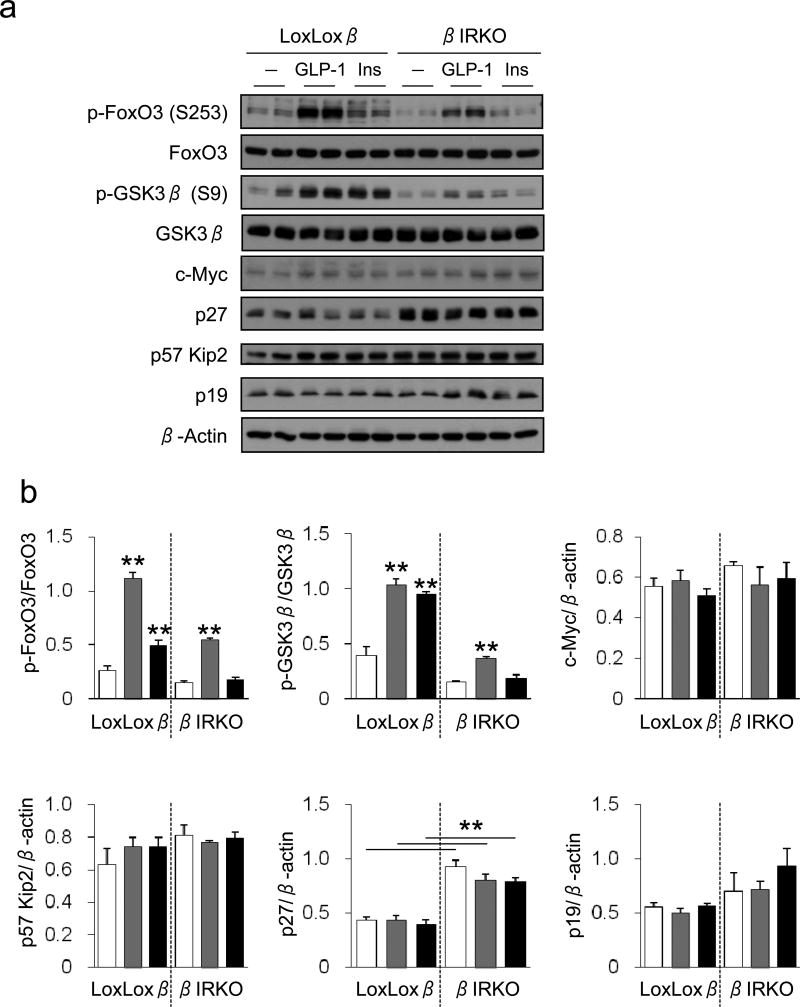
Fig. 7.
Effects of GLP-1 and insulin on beta cell lines. (a) Western blotting for total and p-FoxO3, total and p-GSK3β, c-Myc, p27, p57 Kip2 and p19. βIRKO beta cells and control beta cells (LoxLoxβ) were treated with or without 10 nmol/l GLP-1 or 100 nmol/l insulin for 15 min. (b) Relative phosphorylation of FoxO3 and GSK3β normalised to respective total protein expression. Protein expression for c-Myc, p57 Kip2, p27 and p19 were normalised for actin expression. White bars, control untreated cells; grey bars, GLP-1-treated cells; black bars, insulin-treated cells. All data are expressed as mean ± SEM. n=3 in each group. **p<0.01 vs control condition, or as indicated

