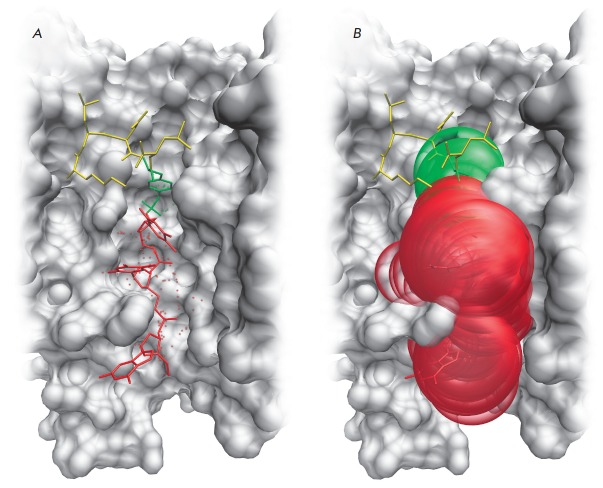
Fig. 2.
The substrate-binding groove in the human Tdp1 model. (A) The interaction of the substrate molecule with the oligonucleotide and phosphotyrosine binding sites. The oligonucleotide is shown in red, phosphotyrosine is shown in green, and the rest of the peptide is shown in yellow. Cavities are labeled with points corresponding to the centers of alpha spheres. (B) The localization of alpha spheres in the oligonucleotide and phosphotyrosine binding sites.

