
Figure 6.
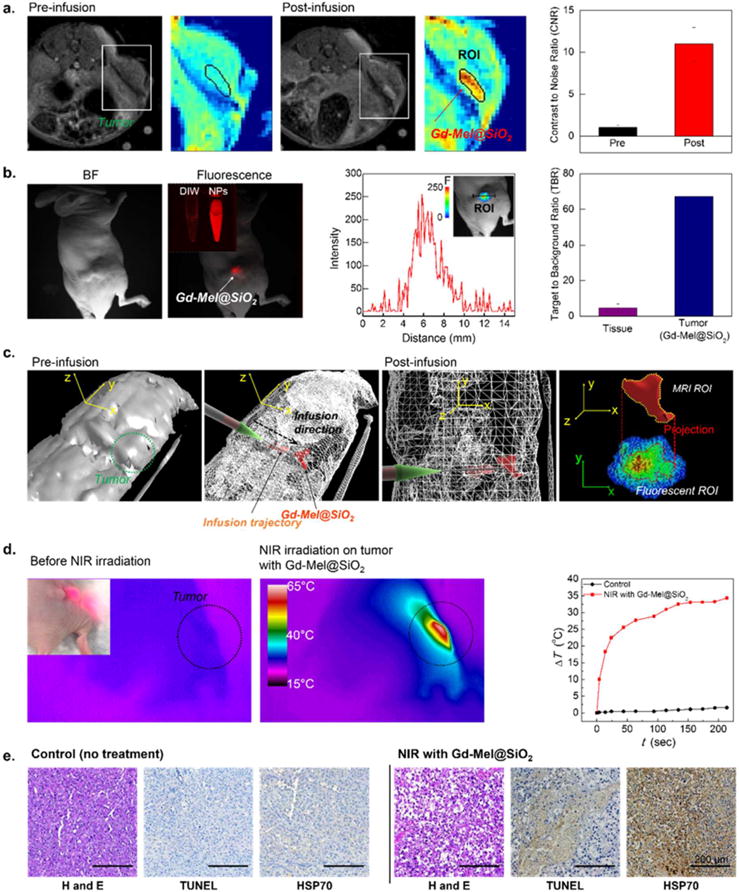
(a) T1 MR images of human prostate tumor xenograft mouse at pre- and postinfusion of TRITC-labeled Gd-Mel@SiO2 NPs, where the area of tumor is indicated with color map images and the region of inoculated TRITC-labeled Gd-Mel@SiO2 NPs is indicated with red color. Contrast to noise ratio (CNR) in the region of interest (ROI), indicated in the MR color map images with black lines from a pre- and postinjected tumor. (b) (b, left) BF and fluorescent images of the mouse after injection of TRITC-labeled Gd-Mel@SiO2 NPs, as indicated in each panel. The inset image shows vials with distilled water and solution containing TRITC-labeled Gd-Mel@SiO2 NPs. (b, center) Line scan of fluorescent intensity in the tumor with TRITC-labeled Gd-Mel@SiO2 NPs. The inset image shows a color map of fluorescent intensity in ROI. (b, right) Target to background ratios (TBR) of the normal tissue and tumor after the injection of TRITC-labeled Gd-Mel@SiO2 NPs. (c) Three-dimensional (3D) views that were reconstructed with coronal MR images of pre- (c, first) and postinfusion (c, second and third) of TRITC-labeled Gd-Mel@SiO2 NPs. High MR T1 contrast area was delineated as ROI which contains both injection trajectory and delivered region of TRITC-labeled Gd-Mel@ SiO2 NPs, as indicated with red color. (c, fourth) A coregistered image combining a projection of 3D ROI from MR and two-dimensional (2D) fluorescent images of the detected TRITC-labeled Gd-Mel@SiO2 NPs. (d) Temperature mapping images before and after radiation of NIR. Human prostate tumor xenograft mice were treated with multimodal image guided infusion of TRITC-labeled Gd-Mel@SiO2 NPs. (inset) A digital image of focused NIR light on the region of infused. The scale of temperature is indicated in a color bar. (d, rightmost) Time-dependent temperature increase (ΔT) of tumor regions with and without TRITC-labeled Gd-Mel@SiO2 NPs, when NIR was radiated with the power of 188 mW/cm2. (e) Haematoxylin and Eosin (H&E), terminal deoxynucleotidyl transferase dUTP nick end labeling (TUNEL), and heat shock protein 70 (HSP 70) stained histological images of tumors without and with TRITC-labeled Gd-Mel@SiO2 NPs, collected after NIR radiation with power of 188 mW/cm2 for 3 min.