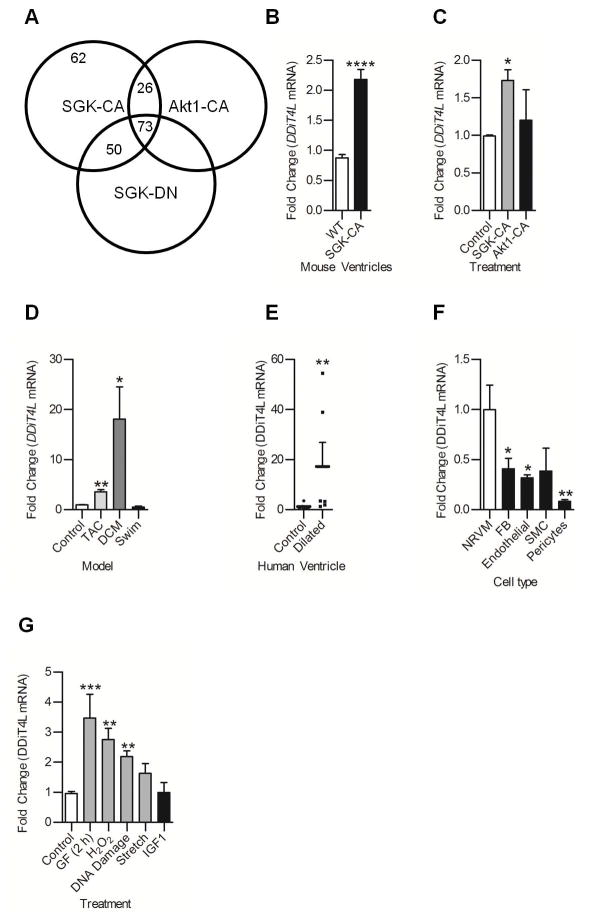
Figure 1. DDiT4L expression is increased in mouse models of pathological hypertrophy and cell models of pathological stress.
(A) DSAGE results showed 62 transcripts increased in mice overexpressing SGK-CA, a model of pathological hypertrophy, which were not changed in mice overexpressing Akt-CA or SGK-DN. For each genotype, DSAGE was run on a pool of 5 mouse heart samples. Parameters were a fold change of at least 1.5, p<0.001, sense, redundancy greater than 2, and for mice overexpressing Akt-CA or SGK-DN these transcripts were not increased more than 1.4 fold.
(B,C) DDiT4L expression was increased in SGK-CA mouse hearts and in neonatal rat ventricular cardiomyocytes (NRVMs) infected with SGK-CA virus but not wild-type mouse hearts or NRVMs infected with myr-Akt virus; n=3–5 mice per genotype, or 4 Ad-infections, 2 dishes per infection. One Way ANOVA followed by Bonferroni posttest, *p<0.05, ****p<0.0001 compared to controls.
(D) DDiT4L expression was increased in transverse aortic constriction (TAC) and genetic dilated cardiomyopathy (DCM) but not in an exercise (swim) model of hypertrophy. n=3–5 mice per model. One Way ANOVA followed by Bonferroni posttest, *p<0.05, **p<0.01 compared to controls.
(E) DDiT4L expression was increased in left ventricular tissue from left ventricle of human dilated cardiomyopathy patients at time of explant compared to controls. n= 6–8 patients. Mann-Whitney nonparametric test, **p<0.01, compared to controls
(F) DDiT4L expression was greatest in cardiomyocytes (NRVM) compared to other cell types in the heart. n=3 preparations, two samples per preparation. One Way ANOVA followed by Bonferroni posttest *p<0.05, **p<0.01 compared to cardiomyocytes. FB – fibroblast, SMC – smooth muscle cell
(G) DDiT4L expression was increased in models of pathological stress in NRVMs and unchanged in a physiological model (IGF-1 treatment). n=3–4 preparations, two samples per preparation. GF: glucose and serum deprivation. One Way ANOVA followed by Bonferroni posttest *p<0.05, **p<0.01, compared to controls

