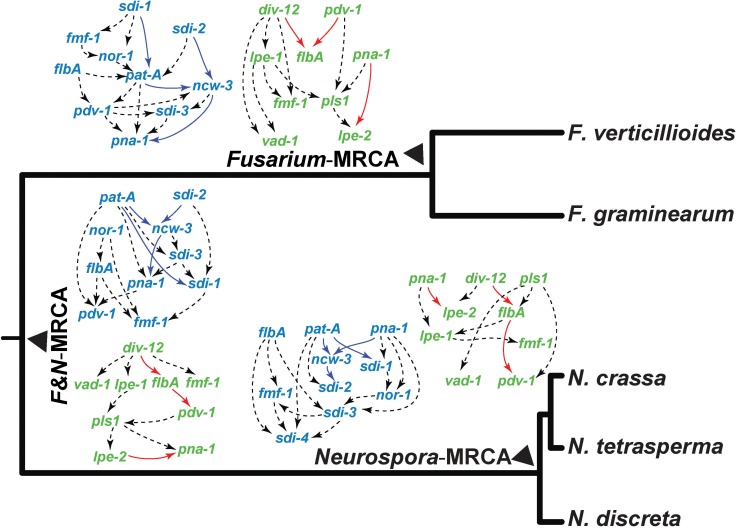
Fig 5. Gene interaction networks underlying early perithecial development in N. crassa (left, blue) and F. graminearum (right, green), represented by directed acyclic graphical models of selected genes (S7 Table), displayed in proximity to the cognate ancestor in the phylogeny of Neurospora and Fusarium species.
Genes within networks were suggested by assembling genes with common knockout phenotypes observed within each species. Networks were inferred from the expression level changes measured between all equivalent stages of development in the three most recent common ancestors of these Neurospora and Fusarium species. Arrows indicate an inferred causal dependency of the two genes they connect. Edges are depicted by dashed black arrows, unless they are present within all three putative ancestral nodes regardless of orientation, in which case they are depicted in blue within the Neurospora-specific network, or pink within the Fusarium-specific network.

