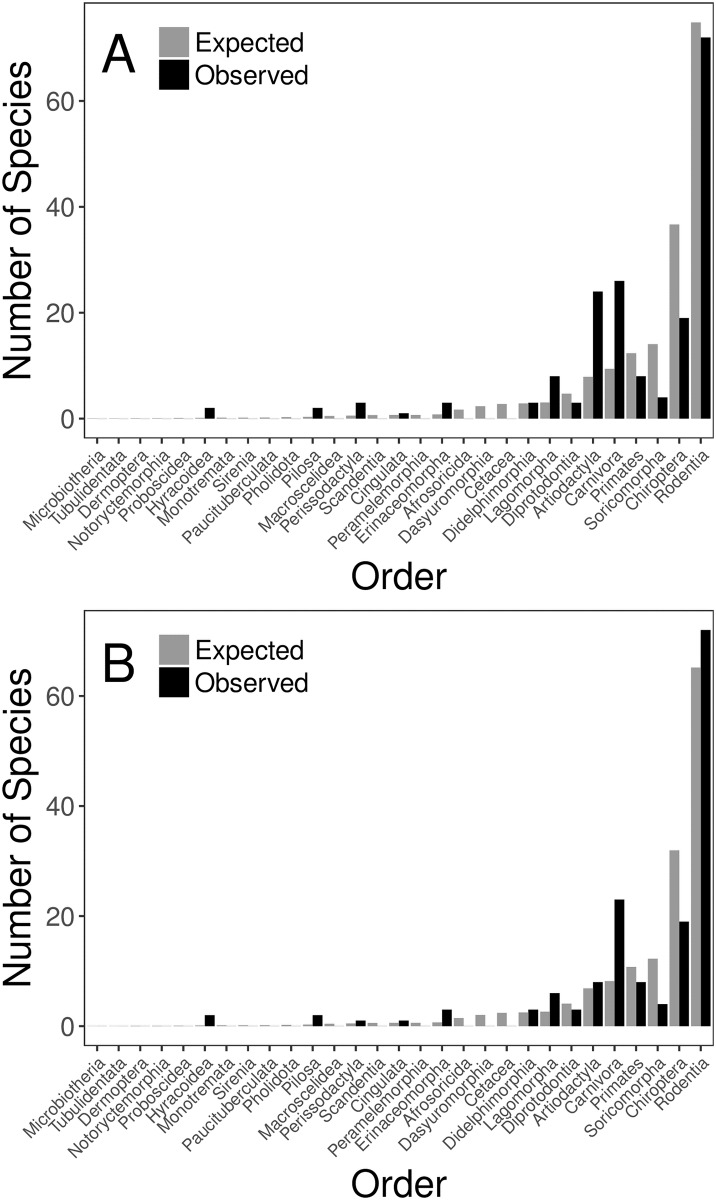
Fig 1. Expected versus observed representations of mammalian orders among reservoirs.
The expected representations (gray bars) assume that orders are found among reservoir mammals in the same proportion as they are among all mammals (n = 5,416) listed by Wilson and Reeder [22]. Observed bars (black) show the number of unique mammalian species in each order that were identified as reservoir hosts in this study. (A) shows the results for all systems (n = 330) in which 178 mammalian species were found to be reservoir hosts. (B) shows results for the human target subset of systems (n = 261) in which 155 mammalian species were found to be reservoir hosts.

