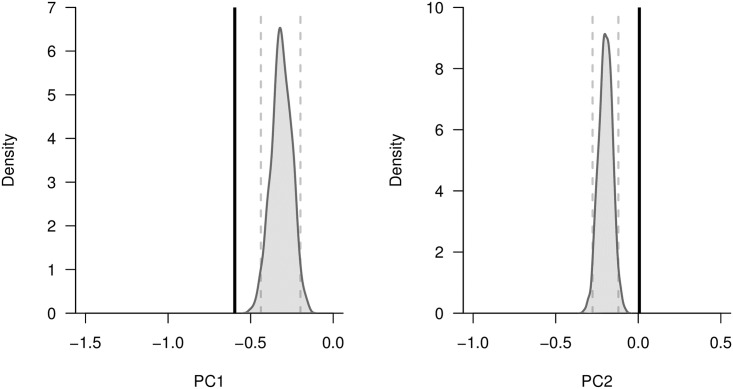
Fig 4. Kernel density plots comparing mean principal component scores for all mammalian species versus mammalian reservoir species.
PCA was conducted on six key residual life history traits: gestation length (days), litter size, neonate body mass (g), interbirth interval (days), weaning age (days), and age at sexual maturity (days). We then used scores from the first two PC axes as variables of interest in imputation tests. To generate an expected distribution of mean PC scores, we randomly generated 1,000 sets of mammalian species that had the same taxonomic representation (at the order level) as the unique mammalian reservoir species we identified. By calculating the mean PC scores for these random sets of species, we were able to generate the mean PC score distributions displayed in grey. The 2.5th and 97.5th percentiles of each distribution are represented with dashed vertical grey lines. For comparison, the observed mean PC score of the identified mammalian reservoir species is shown as a vertical black line.

