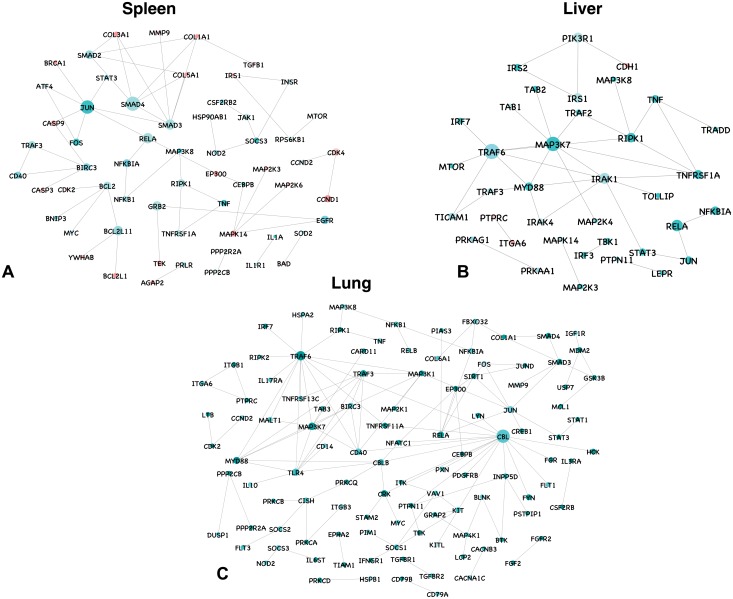
Fig 3. Protein–protein interaction network for differentially expressed genes involved in KEGG pathways in spleen, liver and lung at late stage of infection.
All the upregulated genes are shown in green, and downregulated genes in red, with the gradient showing the extent of expression. The diameter of the node represents the connectivity/degree of the node among the DE genes.

