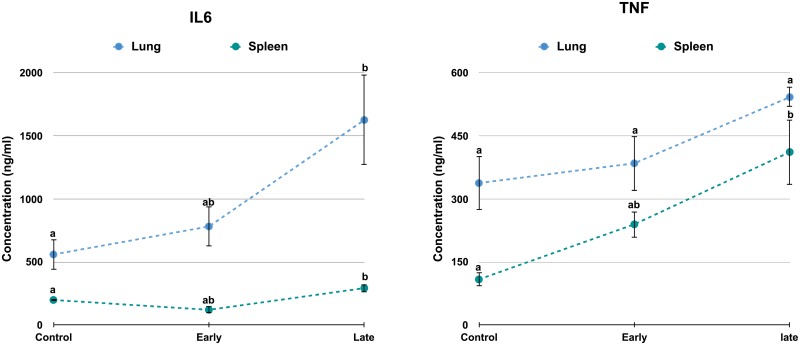
Fig 6. Level of TNF and IL-6 in spleen and lung by ELISA.
Concentration (ng/ml) of TNF and IL6 was plotted against the control, early infection and late infection in spleen and lung. Significant difference (P ≤ 0.05) was calculated using Tukey’s HSD in JMP 12.0 (n = 3). Levels not connected by same letter are significantly different.

