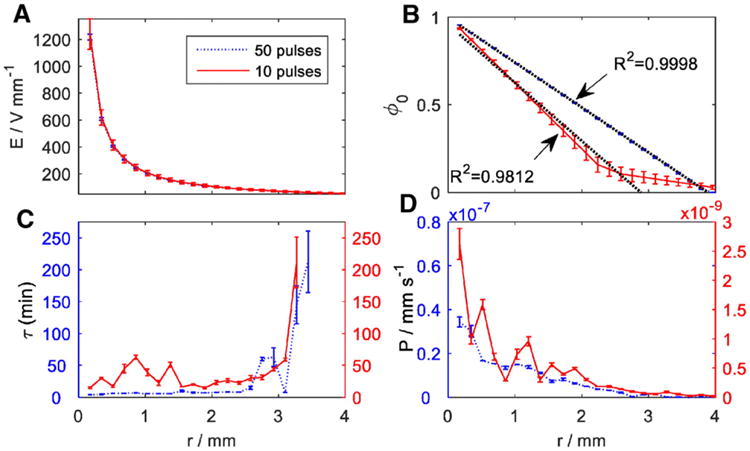
Fig. 2.

(A) The distribution of electric field strength from the center toward the circular electrode, (B) Distribution of initial pore fraction, ϕ0, at m = 10 and 50 pulses with linear regression fitting till the critical radii, (C) Best-fit values for pores time decay vs. distance for the center electrode (D) Best-fit values for permeability coefficient of Calcein obtained for m = 10 and 50 pulses vs. radial distance from the center electrode.
