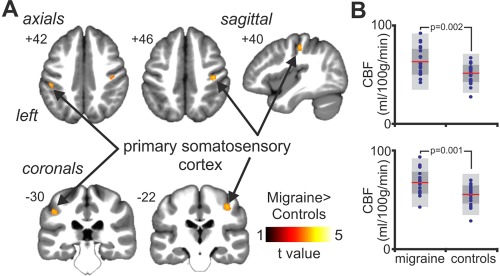
Figure 2.

(A) Regional blood flow increases (hot scale bar) in migraine subjects as compared with healthy controls, overlaid onto axials, coronals and a sagittal T1‐weighted anatomical image set. Slice locations are located at the top left of each image and are in Montreal Neurological Institute space. Note that voxel‐wise comparison was restricted to the primary somatosensory cortex, derived from Harvard–Oxford probabilistic cortical atlas. (B) Plots of cerebral blood flow (CBF) values for the left (top) and right (bottom) primary somatosensory cortex. Individual data plots are shown in blue, with the mean (red line), 1 standard deviation (dark‐grey region) and with the 95% confidence interval (light‐grey region). Significant differences between migraine patients and healthy controls were determined using an independent two‐sample t test, with the P value above the plots. [Color figure can be viewed at http://wileyonlinelibrary.com]
