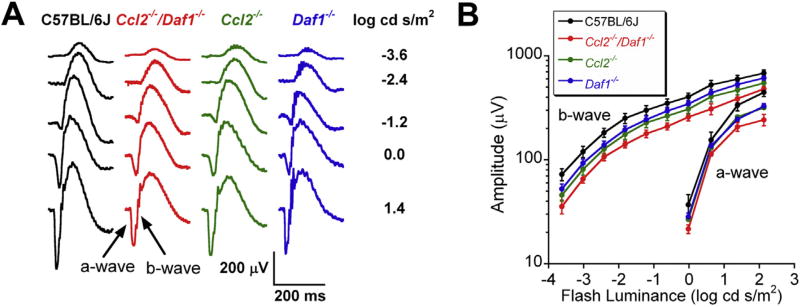
Fig. 2.
Electroretinography. (A) Representative waveforms obtained to strobe flash stimuli presented to the dark-adapted eyes of 12 month old mice. Stimulus strength is indicated to the right of each row of waveforms. (B) Luminance-response functions for a- and b-wave amplitude. Data points indicate the mean ± SE for 7–12 mice.

