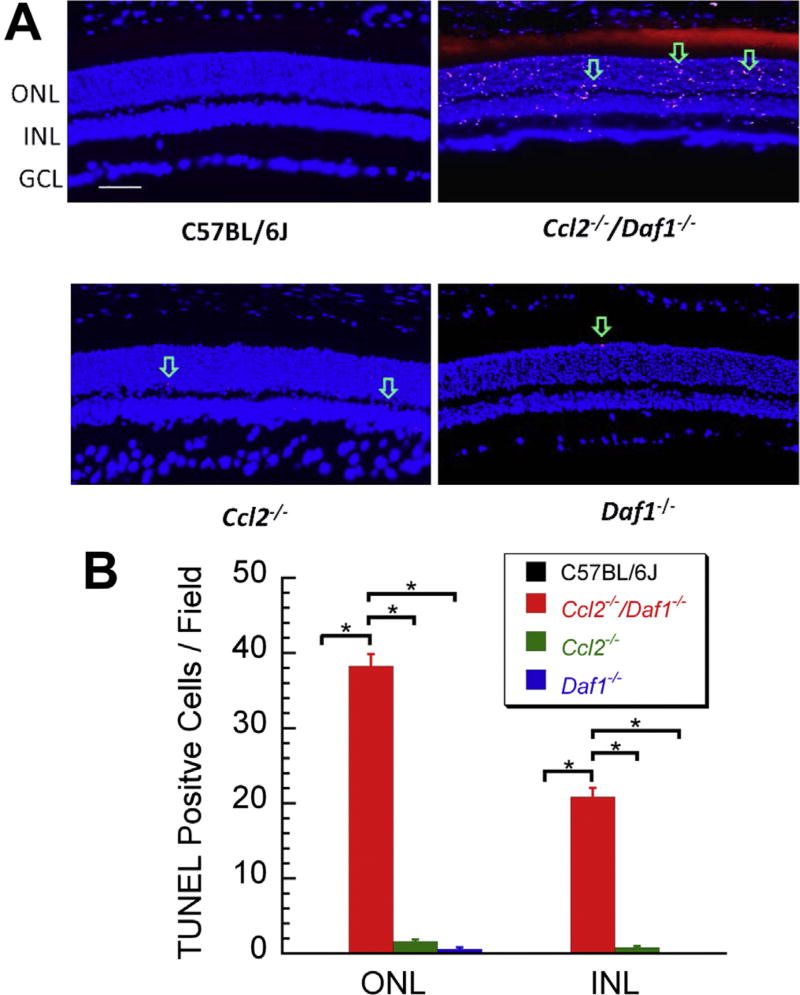
Fig. 4.
TUNEL analysis. (A) Representative images of retinal sections taken next to the optic nerve head for each genotype. The arrows indicate some of the TUNEL-positive cells which are seen in the ONL and the INL of mutant but not C57BL/6J mice. The scale bar indicates 50 µm. (B) Average number of TUNEL-positive cells counted in the ONL (left) and INL (right) of C57BL/6J, Ccl2−/−/Daf1−/−, Ccl2−/−, or Daf1−/− mice. The greatest number was noted in Ccl2−/−/Daf1−/− retinas. Bars indicate the mean ± SE for three mice of each genotype. *p < 0.01.

