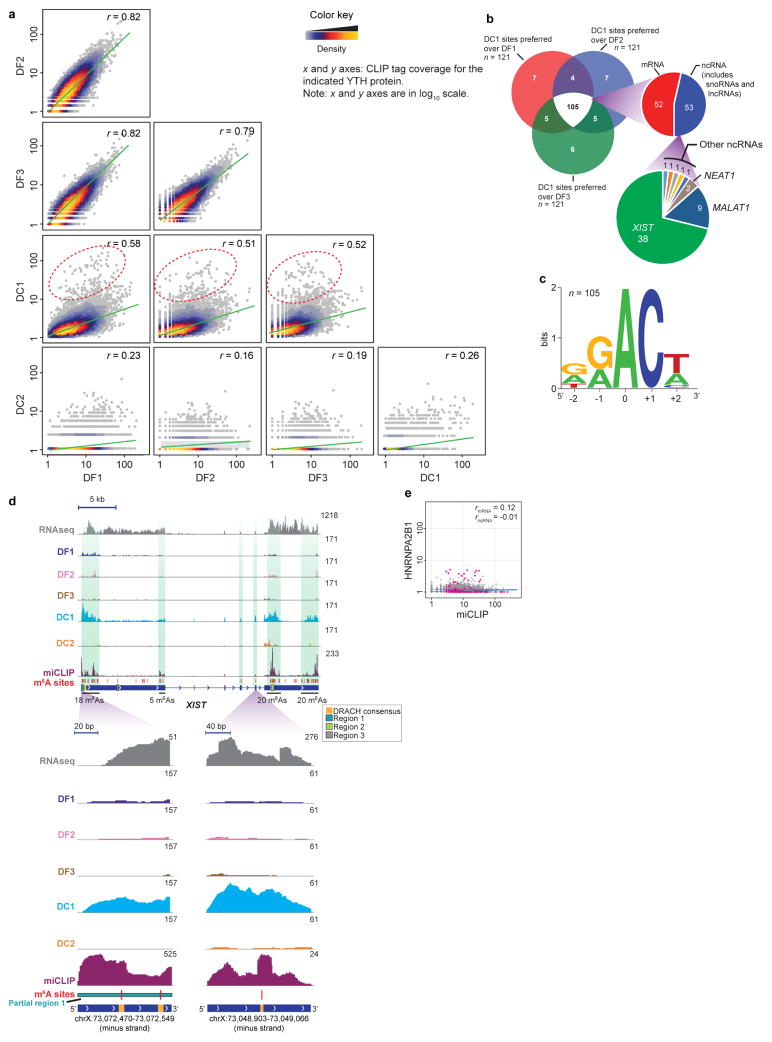
Extended Data Figure 8. DC1 preferentially binds to a subset of m6A sites that are primarily localized to XIST and other ncRNAs.
a, Pairwise comparison of YTH iCLIP libraries, and identification of DC1 preferred m6A sites. Shown are data used to generate the heat map in Extended Data Fig. 7h. In each pairwise analysis, two YTH proteins were compared for their binding to each m6A residue using normalized tag counts (see Methods), providing an estimate of the preferred binding partner for each m6A site for each YTH protein comparison. Tag counts in a window surrounding each m6A genomic coordinate (10 bp upstream and downstream) were determined for each YTH protein. Scatter plots are shown for each pair of indicated YTH proteins. m6A sites are plotted as points in which x and y coordinates represent the tag counts in the compared libraries. The DF family of proteins show highly similar binding preferences as indicated by their high Pearson correlation coefficients (r, top right corner of each plot). Hierarchical clustering as shown in Extended Data Fig. 7h supports the overall relatedness of the binding preferences of DF proteins. However, DC1 and DC2 show a pattern different from the DF proteins. DC2 shows low tag coverage on most m6A sites, and thus yields low r values. Notably, DC1 shows a global de-enrichment of binding at DF1, DF2 and DF3-preferred sites as seen by the flattened trend line (green). Additionally, DC1 shows enrichment at a unique set of m6A sites (the 1% of sites furthest from the trend line is highlighted with a red dashed ellipse in the comparison between DC1 and DF1, DF2 and DF3). b, A Venn diagram showing the number of sites preferred for DC1 over DF1, DF2 and DF3. The vast majority (105, white shaded area) are the same between each comparison, meaning these sites are preferred by DC1 over any DF protein. The rightward projection shows that most of these m6A sites are in ncRNA, constituted primarily of XIST m6A sites. c, Sequence logo analysis shows that the DC1-preferred m6A sites conform to the DRACH-like m6A consensus motif seen throughout the transcriptome, not in a novel DC1-specific motif. d, Zoomed-in views of iCLIP tag distribution on XIST for the five YTH proteins on XIST. The miCLIP tag distribution also identifies regions enriched in m6A. Only DC1 (blue) exhibits prominent iCLIP tags on XIST, the other YTH proteins do not. Vertical green shading marks the regions of XIST that contain the highest density of m6A sites. RNA-seq reads are shown in read counts, iCLIP and miCLIP tags are shown in uTPM. Regions 1 and 2 contain RBM15/15B-binding sites, region 3 does not. These sites are indicated by coloured boxes. DC1 shows a higher number of iCLIP tags at regions 1 and 2, areas containing several m6A sites. Although region 3 (grey) shows a putative m6A site, DC1 shows poor binding, possibly owing to the structural organization of XIST. e, HNRNPA2B1 does not bind m6A sites on XIST. HNRNPA2B1 was previously shown to bind m6A sites on primary micro RNA (pri-miRNA) transcripts35. We compared HNRNPA2B1 HITS-CLIP and miCLIP17 tag coverage (±10 bp in uTPM) at 11,530 annotated m6A sites, and determined correlation coefficients for m6A sites in mRNA (red) and in ncRNA (blue). HNRNPA2B1 does not show any significant binding to m6A sites on mRNA and ncRNA. Notably, the miCLIP-identified m6A sites17 used in this analysis lacks m6A sites from pri-miRNAs.

