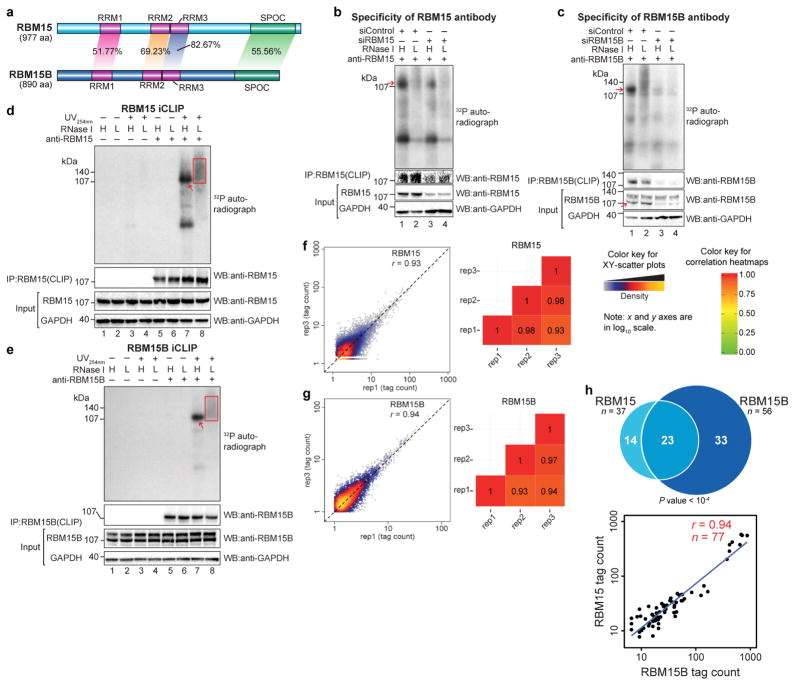
Extended Data Figure 1. Validation of RBM15 and RBM15B antibodies for iCLIP, construction and comparison of iCLIP library replicates.
a, RBM15 and RBM15B exhibit high sequence homology. RBM15 and RBM15B comprise three RRM domains (RRM1, 2 and 3, all in purple) and a C-terminal SPOC domain (green). These domains show high sequence identity between RBM15 and RBM15B (indicated on the shaded areas that connect the compared regions). RRM, RNA recognition motif; SPOC, Spen paralogue and orthologue C-terminal. b, c, Validation of specificity of RBM15 and RBM15B antibodies for iCLIP, performed using immunoprecipitation. In each experiment, we used high (H) and low (L) RNase, as per the iCLIP validation protocol30 (see Methods). The bottom western blots are loading control (GAPDH). To confirm knockdown, RBM15 and RBM15B protein levels are shown. Additionally, we show the amount of protein in the anti-RBM15 or anti-RBM15B pulldowns. These experiments confirm that the RBM15 and RBM15B are knocked down after siRNA transfection. d, e, Autoradiograms of the samples used for the RBM15 and RBM15B iCLIP experiments. Shown are the representative autoradiograms from the nitrocellulose blots of samples used for preparing the RBM15 and RBM15B iCLIP library. The excised portion of the membrane is shown (red square). The red arrow indicates the position of RBM15 and RBM15B protein after high RNase treatment that matches with the size seen in b and c respectively. Both RBM15 and RBM15B show specific RNA–protein conjugates of expected size with a minimal contamination of RNA–protein conjugates of other sizes. f, g, RBM15 and RBM15B iCLIP replicates show reproducible iCLIP tag coverage on the human genome. Three iCLIP library replicates were prepared for RBM15 and RBM15B. We compared the normalized tag counts of replicates in 100 nucleotide bins in the human genome on scatter plots, and estimated the Pearson correlation coefficient (r). Shown are the representative scatter plots (left), and heat maps (right) showing the obtained r value in multiple pairwise replicate comparisons. rep1–rep3, replicate 1–replicate 3 for each protein; RBM15 in f and RBM15B in g. The x and y axes of the scatter plots represent normalized tag counts in uTPM in 100 nucleotide bins on the human genome in rep1 and rep3, respectively. Correlation values are indicated on each tile. From this analysis, RBM15 and RBM15B iCLIP replicates show a similar, highly reproducible iCLIP tag coverage on the human genome. The diagonal dashed line in scatter plots represents reference trend line for a perfect correlation (r = 1, x = y). h, RBM15 and RBM15B show similar binding preferences on XIST. Each of the 30 clusters in the RBM15 data set overlapped with the clusters in the RBM15B data set. We also examined the CITS induced by RBM15 and RBM15B. CITS are single-nucleotide sites that represent direct contacts of these proteins with XIST (Supplementary Tables 3, 4). Most RBM15 CITS (23 out of 37) overlapped with RBM15B CITS (top). This overlap was statistically significant (P < 0.0001) based on a permutation analysis in which we measured the overlap of randomly selected sites on XIST for RBM15 and RBM15B (see Methods). Lastly, a pairwise analysis of iCLIP tag density at each CITS showed that RBM15 and RBM15B binding was highly correlated (bottom).

