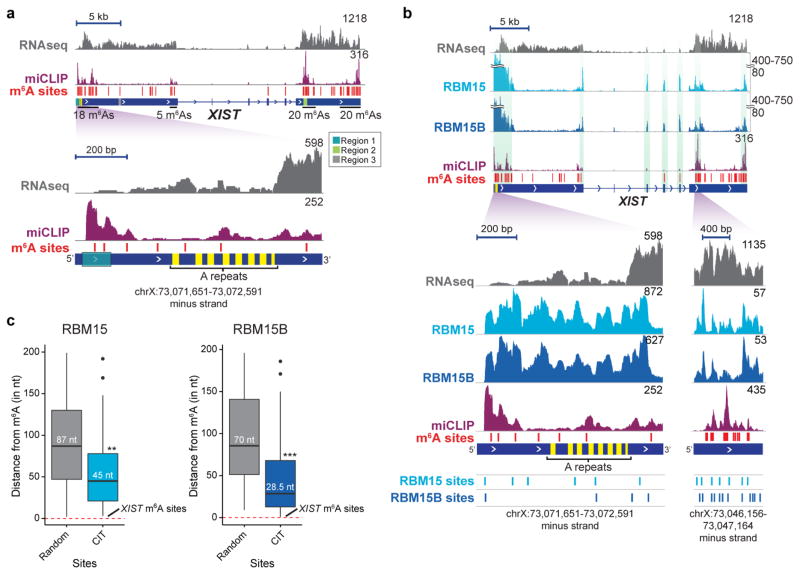
Extended Data Figure 4. Zoomed-in views of miCLIP, RBM15 and RBM15B iCLIP tracks on XIST.
a, m6A residues are broadly distributed along XIST. Shown are m6A residues mapped in XIST using miCLIP17;these sites are indicated with red lines. Total RNA at every genomic position are shown in purple. RNA-seq read distribution is shown in grey. Many of the m6A sites are clustered in a 2 kb domain surrounding the A-repeat (yellow) region. The zoomed-in region shows m6A sites (red lines) and miCLIP tag distribution in a 1-kb region closest to the A-repeat region. Region 1, which contains RBM15/15B-binding sites (see Fig. 2b) is also indicated. b, c, RBM15 and RBM15B bind XIST near m6A sites. To determine whether RBM15/15B-binding sites are in proximity to known m6A sites, we compared the iCLIP tag clusters with m6A sites on XIST. Shown in b are the RBM15 and RBM15B iCLIP, and miCLIP tag distributions on XIST. m6A sites are marked with red bars above the XIST gene model. Vertical green shaded boxes mark the regions of miCLIP and RBM15/15B iCLIP tag cluster alignments. A zoomed-in view of a region with high-tag abundance (bottom left) and another with low-tag abundance (bottom right), show examples of m6A sites that are in proximity to RBM15B and RBM15B tag clusters. Normalized tags are shown in uTPM. In c, the median distance of RBM15 (left) and RBM15B (right) CITS to the nearest m6A site on XIST was determined and compared with a randomly permuted data set of RBM15- and RBM15B-binding sites. RBM15/15B-binding sites show a marked proximity to m6A compared to randomly positioned RBM15/15B sites (RBM15, **P = 0.0026, number of permutations, 10,000; RBM15B, ***P = 0.0001, number of permutations, 10,000). This proximity is not due to RBM15 or RBM15B itself binding m6A as its binding to XIST was unaffected by METTL3 or WTAP knockdown (Extended Data Fig. 3g). The red dashed line indicates the location of m6A sites.

