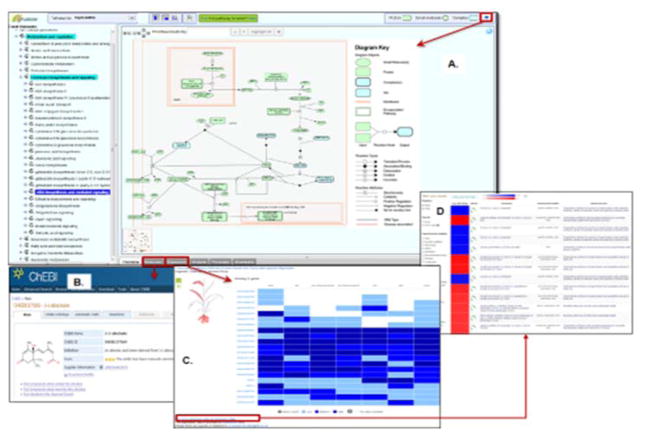
Fig. 2.
A view of the Plant Reactome Pathway Browser page. (A) An example of the ‘abscisic acid biosynthesis and mediated signaling pathway’ page from O. sativa. The left-hand side panel shows a hierarchical list of the available rice pathways, and the right-hand side upper panel shows a pathway diagram (depicted in the context of the plant cell’s subcellular structure) along with a diagram key. The ‘Zoom’ feature helps users visualize pathway diagrams more clearly. The lower panel, below the pathway diagram, provides options for exploring pathway-associated features, such as a list of proteins and small molecules with external links, e.g., to ChEBI (B); baseline tissue-specific expression data from EMBL-EBI’s Expression Atlas (C); and access to differential expression data at EMBL-EBI’s Atlas (D).

