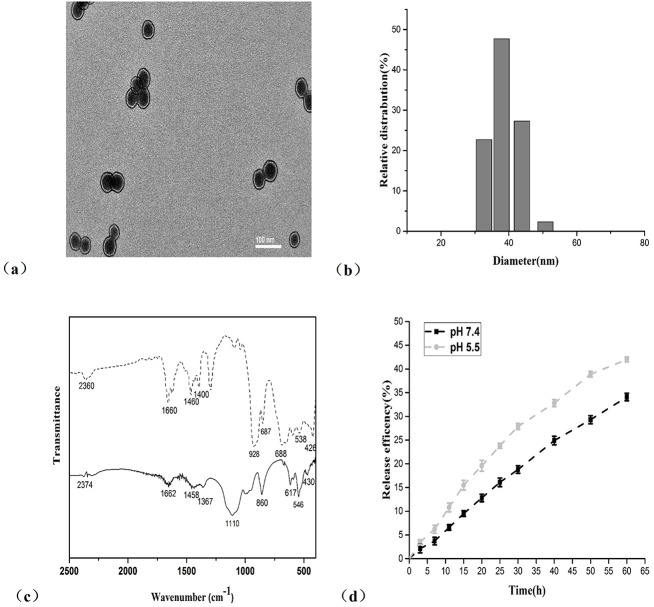
Fig 2. Characterization and release efficiency of the POM@SiO2 nanoparticles.
(a) TEM images of AsMo6@SiO2 nanoparticles. The scale bar is 100 nm. (b) DLS measurement image of the nanoparticles. (c) FT-IR spectra of AsMo6 (dash line) and nanoparticles (solid line). (d) The release efficiency of nanoparticles at pH 7.4 and 5.5. Results represent the mean ± SD from three independent experiments.

