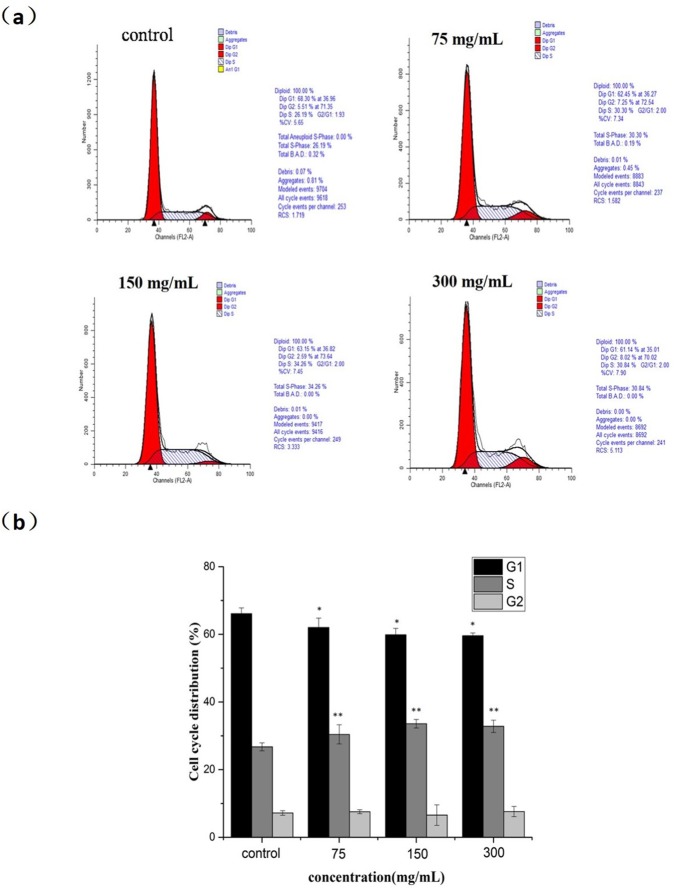
Fig 6. Cell cycle arrest effect of nanoparticles on MCF-7 cells.
(a) Cells were treated with POM@SiO2 nanoparticles (corresponding POM concentration of 20, 40, 80 μg/mL) for 24 h. The distribution of cell cycle was detected by FCM with PI staining. The percentages of G1, S, G2 phase were calculated using ModFit LT software. (b) Statistical results of S phase cells. Results represent the mean ± SD from three independent experiments. *P < 0.05 for G1 phase vs. control. **P < 0.01 for S phase vs. control.

