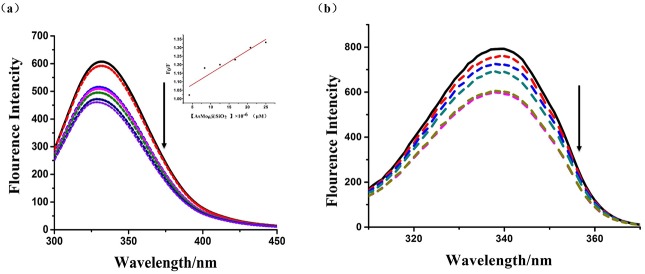
Fig 9. Fluorescence quenching and binding effect study of the nanocomposites.
(a) Fluorescence spectra of HSA (2.5 μM) in the presence of different concentrations of nanoparticles. The arrow shows the fluorescence intensity changes upon increasing concentration of nanoparticles. Inset: Stern-Volmer plot of the fluorescence titration data of HSA with different concentrations of nanocomposites in PBS at room temperature ([POM@SiO2] = 0, 0.125, 0.25, 0.5, 1, 2, 4 × 10⁻² μg/mL). (b) The synchronous fluorescence spectra of HSA (0.02503B0043M) in the presence of different concentrations of nanoparticles at Δλ = 60 nm.

