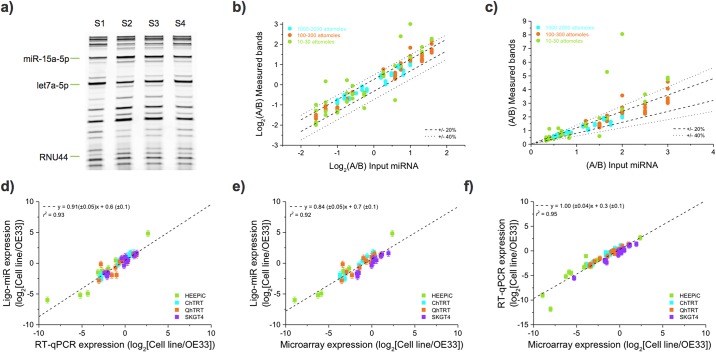
Fig 4. Differential sensitivity and benchmarking of Ligo-miR EZ.
a) PAGE image of Ligo-miR EZ assay performed on S1-S4 synthetic miRNA panels. Three bands are highlighted to show how band intensities change with input level. All bands are detected but low intensity bands are difficult to visualize due to the limited contrast of the print image. b) The ratio of measured band intensities is plotted as a function of expected input ratios. The ratios were determined from the mean of 2 measurements. The three input levels are plotted: high (blue), medium (orange) and low (green). If the measured ratio is exactly equal to the input ratio then the resultant data will fall along the line y = x. For reference, the dotted lines illustrate where the measured ratio varies by ± 20% and ± 40% from the expected ratio. c) Same data as shown in b) but plotted on linear-linear axes. d), e) and f) Benchmarking was performed by using Ligo-miR EZ, TaqMan qRT-PCR, and microarray to perform differential expression analysis of 5 esophageal cell lines, with expression was compared to OE33 in all cases. All platforms showed good correlation to one another.

