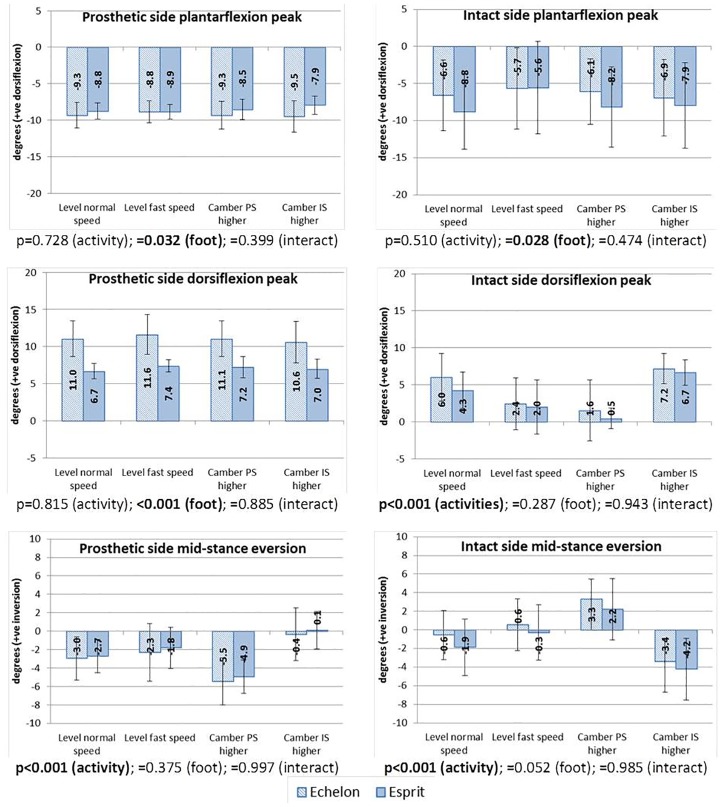
Fig 3. Mean values and standard deviations of the peak values in sagittal plane ankle angles and mid-stance ankle angles in frontal plane.
The sagittal plane ankle movement in the Esprit foot is simulated by the deformation of the foot’s heel and forefoot keels. The p-values of the repeated measures two-way ANOVA are given below each chart. PS = prosthetic side, IS = intact side.

