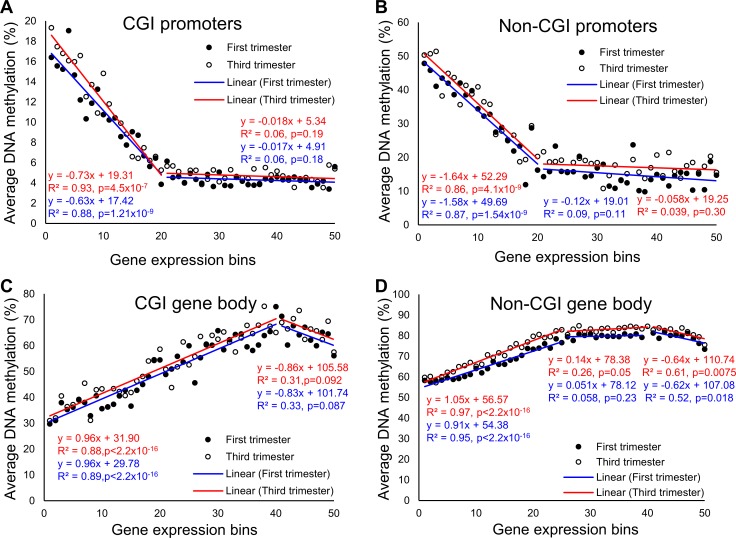
Fig 4. Correlation between DNA methylation and gene expression.
Genes were grouped into 50 bins, in order of increasing gene expression. DNA methylation of the promoter or gene body fragments within each gene expression groups were then averaged to obtain the relationship. (A) Scatterplot of the DNA methylation of promoters in CGI against the gene expression showed anti-correlation for the lower expressed genes. (B) Scatterplot of the DNA methylation of promoters in non-CGI against the gene expression showed anti-correlation for the lower expressed genes. The non-CGI promoters showed higher DNA methylation than the CGI promoters. (C) Scatterplot of the DNA methylation of gene body fragments in CGI against the gene expression shows positive correlation. (D) Scatterplot of the DNA methylation of gene bodies in non-CGI against the gene expression shows positive correlation. The non-CGI gene bodies showed higher DNA methylation than the CGI gene bodies.

