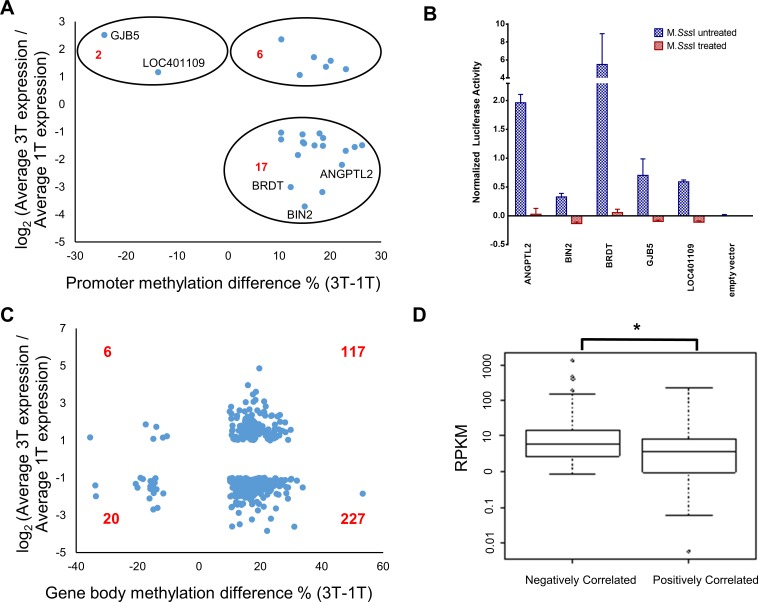
Fig 5. Correlation between significant differential DNA methylation and differential gene expression.
(A) Scatterplot of differentially methylated promoters with differential gene expression between first and third trimester samples. 19 out of 25 promoters showed anti-correlation. (B) Experimental validation of the genes labelled in Fig 5A, showing DNA methylation is associated with gene repression. Dual luciferase assays were performed, using empty vector as negative control. (C) Scatterplot of differentially methylated gene bodies with differential gene expression between first and third trimester samples. Majority of the genes showed negative correlation. (D) The differential expressed and methylated gene bodies from Fig 3C were grouped by positive and negative correlation. A boxplot comparing the initial gene expression at first trimester was given. The negatively correlated group showed elevated gene expression compared to the positively correlated group (2 sided p-value = 8.38*10−6).

