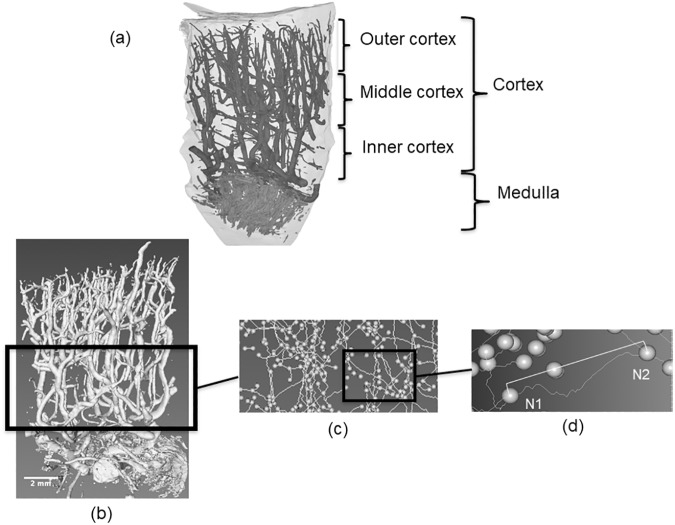
Fig 1. Vascular network analysis.
(A) Subdivision of the renal cortex structure in the outer, middle, and inner cortex. (B) Volume rendering of the vascular network from the renal cortex. (C) Centerline skeletonization showing the nodes (spheres) and vascular segments (lines). (D) Example of a vascular segment between two nodes (N1 and N2). Tortuosity is the ratio between the curvilinear distance between N1- N2 and the respective chord linear distance.

