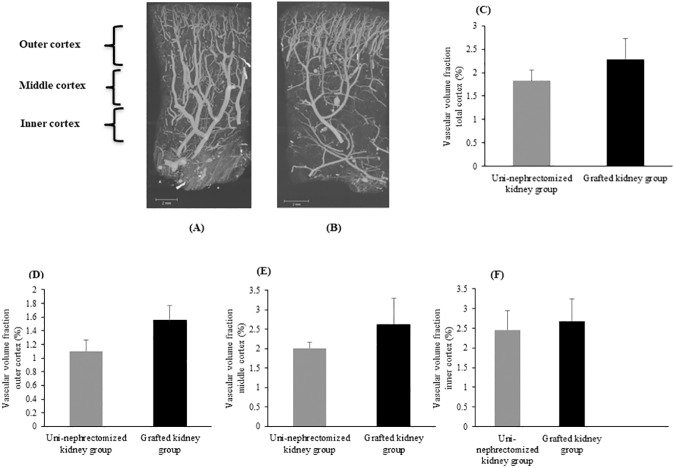
Fig 3. Histogram of vascular volume fractions.
Coronal maximum intensity projection of the vascular network from renal cortex samples: A) Uni-nephrectomized kidney and (B) grafted kidney. Histogram of vascular volume fraction as the ratio between vascular network volume and total sample volume expressed as the percentage in samples of (C) total renal cortex, (D) the outer cortex, (E) middle cortex, and (F) inner cortex from the uni-nephrectomized and grafted kidney groups. Values are expressed as the mean ± SEM.

