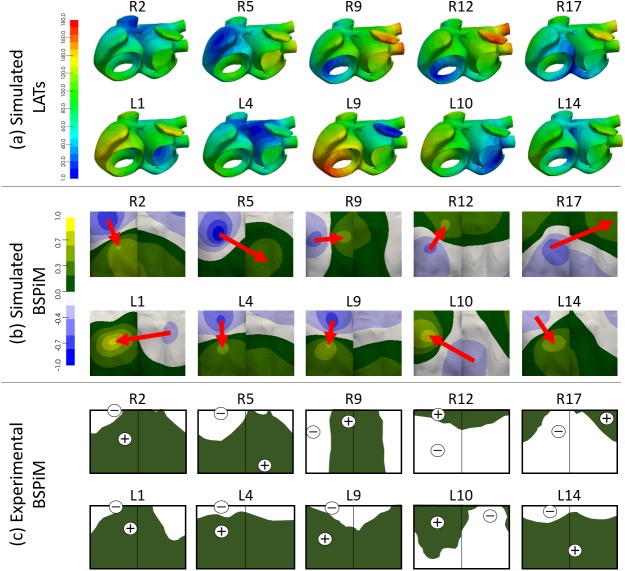
Fig 4. Comparison between simulated and experimental BSPiMs.
(a) Simulated Local Activation Times (LATs) computed when the ectopic sites are located at different positions of the RA (2, 5, 9, 12 and 17) as defined in [8] and locations of the LA (1, 4, 9, 10 and 14) as defined in [10,11]. Bluish colour corresponds to t = 0 ms and reddish colours correspond to the latest activation time. Time is given in milliseconds; (b) Simulated normalized BSPiM computed at the 14.157 nodes of the torso surface for each ectopic focus. Bluish colours correspond to the most negative while yellowish correspond to the most positive integral values. Red arrows represent the position of the minima towards maxima integral values; (c) Experimental integral patterns reproduced from the originals published by SippensGroenewegen et al in [8–11]. White colour means negative integrals (equivalent to the blueish range for the simulated BSPiM) while green colour means positive integrals (equivalent to the greenish to yellowish range for the simulated BSPiM).

