
Figure 3. Nrp1−/− Tregs display increased IFNγ in the tumor microenvironment.
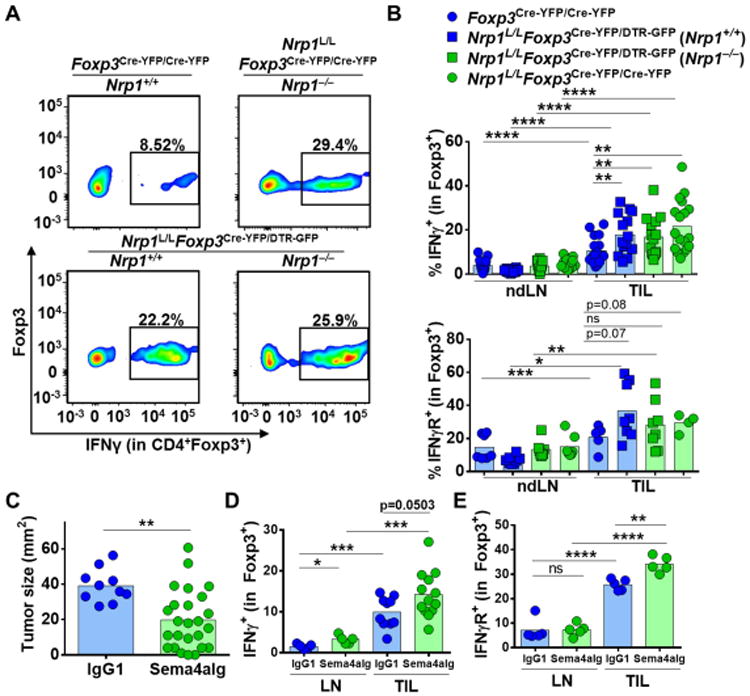
(A-B) Foxp3Cre-YFP/Cre-YFP, Nrp1L/LFoxp3Cre-YFP/Cre-YFP, and Nrp1L/LFoxp3Cre-YFP/DTR-GFP mice were injected with B16.F10 melanoma tumor cells ID on day 0 and sacrificed on day 12. Lymphocytes were isolated from ndLN and TIL of mice noted, stimulated and stained for IFNγ and IFNγR. (n=8-18). (C-E) C57BL/6 mice were injected with B16.F10 melanoma tumor cells ID on day 0. Mice were treated with either Sema4aIg or IgG1 every 3 days until sacrifice starting on day 5 (400ug, 200ug, 200ug, 200ug). (C) Tumors were measured on day 12 for prior to sacrifice (n=10-25). (D) Lymphocytes were isolated from ndLN and TIL, stimulated and stained for IFNγ (n=5-13). (E) Lymphocytes were isolated from ndLN and TIL, and stained for IFNγR (n=5). Data represent 3-4 independent experiments. Student unpaired t test was used. (*p<0.05, **p < 0.01, ***p <0.001, ****p < 0.0001).