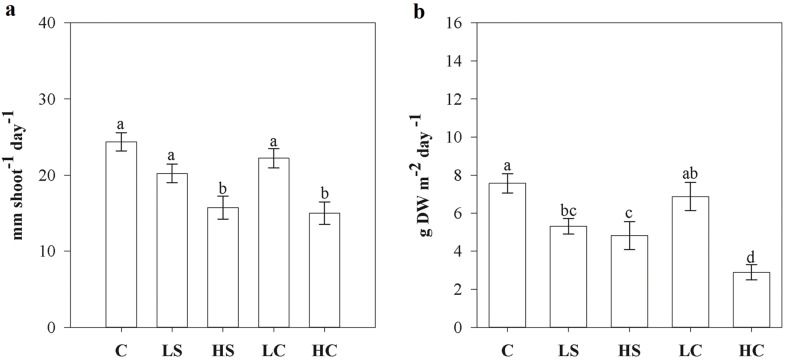
Fig 3.
Leaf elongation rate (A) and resulting calculated biomass growth (B) in treatment and control plots at the end of the four-month manipulative experiment. Measures are mean ±SE, and lower-case letters above bars indicate treatments separated by Student–Newman–Keuls post hoc analyses (p < 0.05). For abbreviations, see Fig 1.

