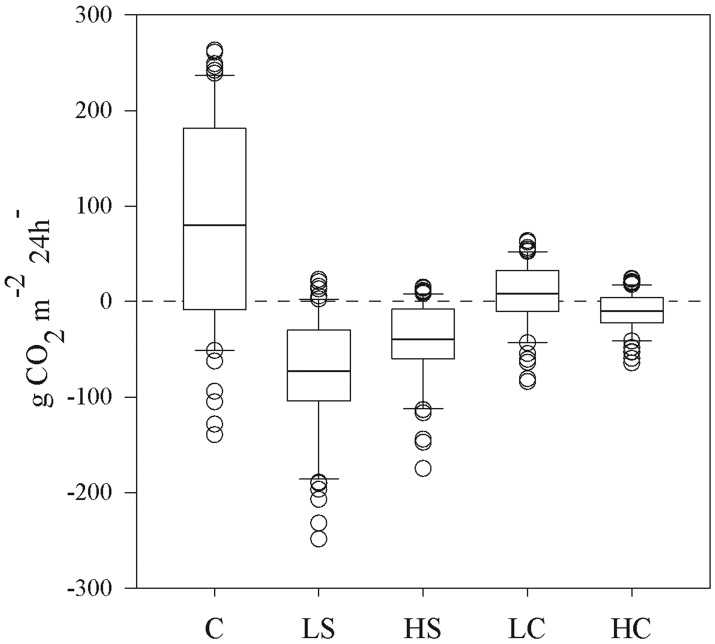
Fig 7. Calculated diel net productivity as CO2 fixation per meadow area and day, shown as a range of minimum and maximum values (for the calculations, see “Materials and methods”).
In the boxes, lines in middle indicate means, upper and lower lines indicate the 75 and 25 quartiles, respectively, upper and lower whiskers indicate maximum and minimum values, respectively, and circles indicate outliers. Lower-case letters above bars indicate treatments separated by Student–Newman–Keuls post hoc analyses (p < 0.05). For abbreviations, see Fig 1.

