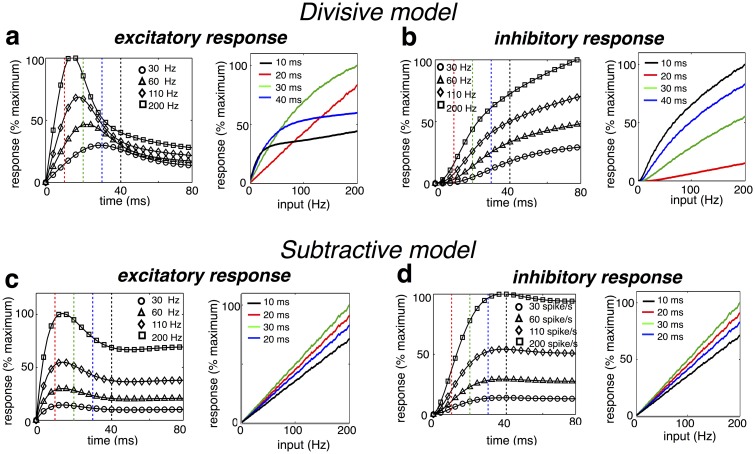
Fig 7. Predicted temporal response profile.
(a, left) Temporal response profile of excitatory neuron, to a constant feed-forward input of varying strength. (right) Instantaneous response of the excitatory neuron versus amplitude of feed-forward input. Each plot corresponds to a fixed time after stimulus presentation (indicated by vertical dashed lines in left panel). (b) Same as (a), but for an inhibitory model neuron. (c-d) Same as a-b, but for a model with subtractive, rather than divisive inhibition.

