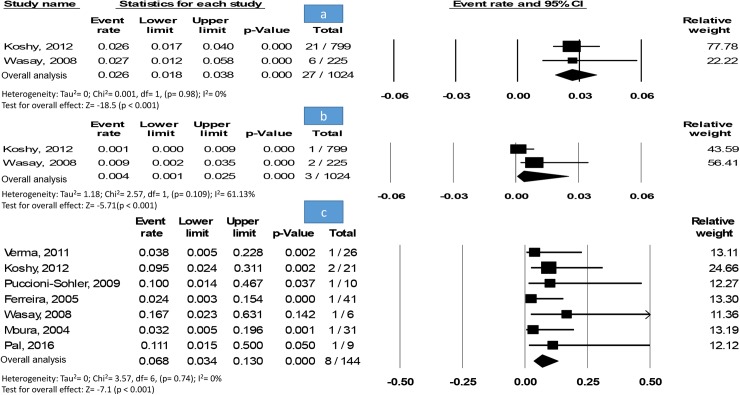
Fig 3. Meta-analysis.
(A) Forest plot of ADEM prevalence among other neurological disorders. Showing the pooled event rate with 95% CI using fixed-effect model. (B) Forest plot of ADEM prevalence within dengue patients. Showing the pooled event rate with 95% CI using a random-effects model. (C) Forest plot of neurological disorders prevalence within dengue patients. Showing the pooled event rate with 95% CI using fixed-effect model.

