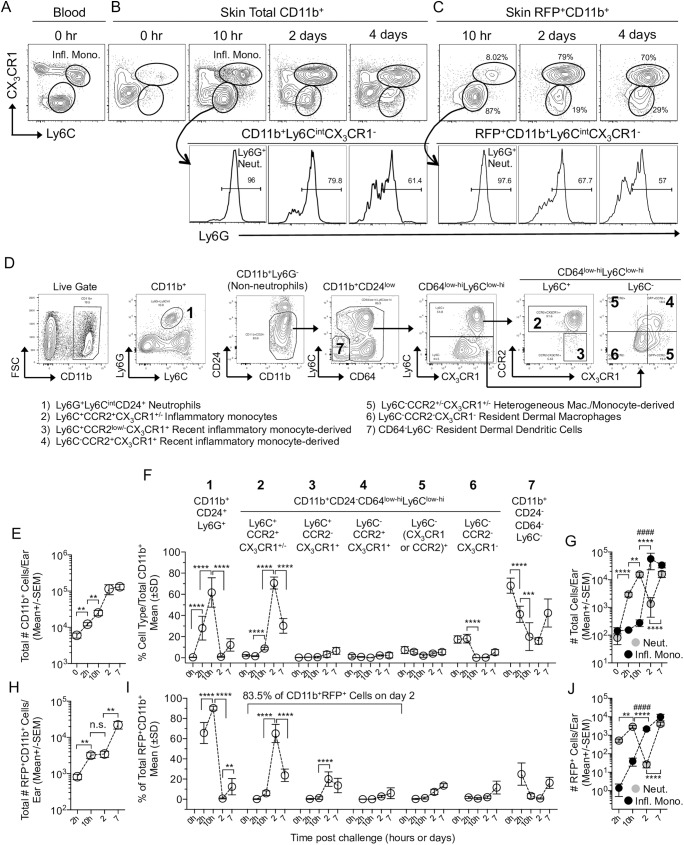
Fig 1. L. major transitions from neutrophils to inflammatory monocytes during acute infection.
C57BL/6 CX3CR1-gfp mice were injected with 2x10⁵ L. major-RFP parasites i.d. in the ear. (A-D) Representative plots of blood or skin cells stained with the indicated markers. (A-C) CX3CR1 and Ly6C expression on total (A and B) or RFP+ (C) CD11b+ cells including Ly6G expression on the CX3CR1-Ly6Cint population (lower panels). Mono.: Inflammatory Monocytes; Neut.: Neutrophils. (D) Representative plots of Live cells (gates as per S1A Fig) from the skin on day 3 p.i.. (E-J) Kinetic analysis of total (E-G) or RFP+ (H-J) CD11b+ populations in the skin. (E, G, H, and I) Enumeration of cells using counting beads. (F and I) Frequency of the indicated subsets within total CD11b+ (F) or RFP+CD11b+ (I) cells. (G and J) Total (G) or RFP+ (J) number of neutrophils (Neut.) or Ly6C+CCR2+CX3CR1+/- inflammatory monocytes (Infl. Mono.) per ear. Data are from one experiment representative of more than 3 similar experiments. Data are the mean. n = 4 (0h), 6 (2h, 10h, 2d) or 10 (7d) ears per group. In E, F, H, and I the asterisks indicate a significant difference between the time points referred to by the brackets. In G and J the symbols indicate a significant difference between the numbers of neutrophils (*) or monocytes (#) at the time points referred to by the brackets. The level of significance is indicated in the materials and methods.

