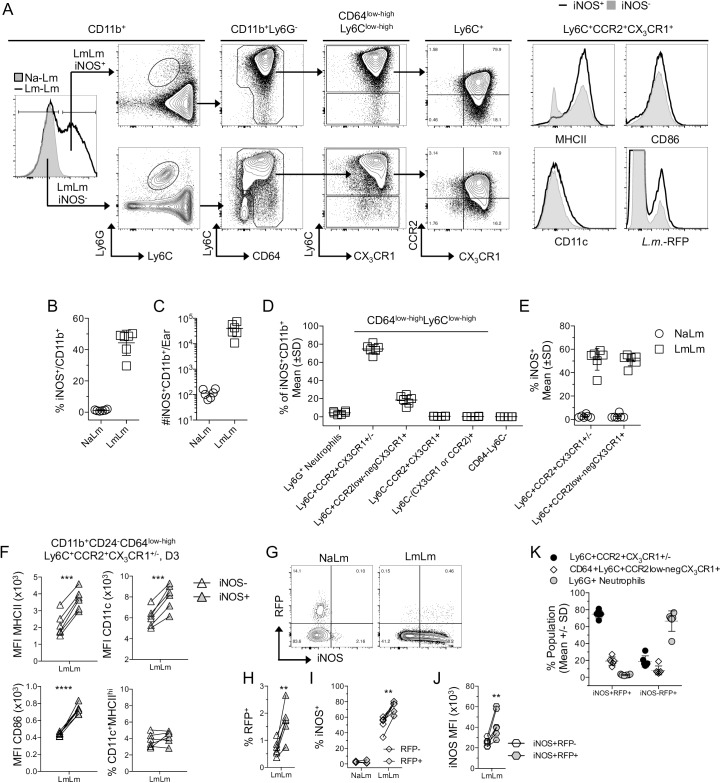
Fig 5. Immature inflammatory monocytes are the predominant iNOS+ cell type at sites of L. major challenge.
Mice as described in Fig 4 were analyzed for iNOS expression on day 3 post-ch. with L. major-RFP. (A) Representative histogram and plots of iNOS+ or iNOS- cells. (B) % or (C) absolute number of CD11b+ cells that are iNOS+ on day 3 post-ch. (D) Frequency of the indicated populations within the total iNOS+CD11b+ population. (E) Percentage of the indicated populations on the x-axis that are iNOS+. (F) MHCII, CD11c, CD86 MFI of, and % of CD11c+MHCIIhi cells within iNOS+ or iNOS- monocytes obtained from the same site of infection. (G) Representative RFP and NOS2 staining of the population described in (F). (H) Percentage of iNOS+ or iNOS- monocytes gated as in (F) that are RFP+. (I) Percentage of RFP+ or RFP- monocytes gated as in (F) that are iNOS+. (J) iNOS MFI of iNOS-producing RFP- versus RFP+ monocytes gated as in (F). Each paired data set represents cells from the same ear. (K) Percentage of the indicated populations within the total CD11b+ infected iNOS+ versus infected iNOS- populations. Data are from one experiment representing 3 similar experiments.

