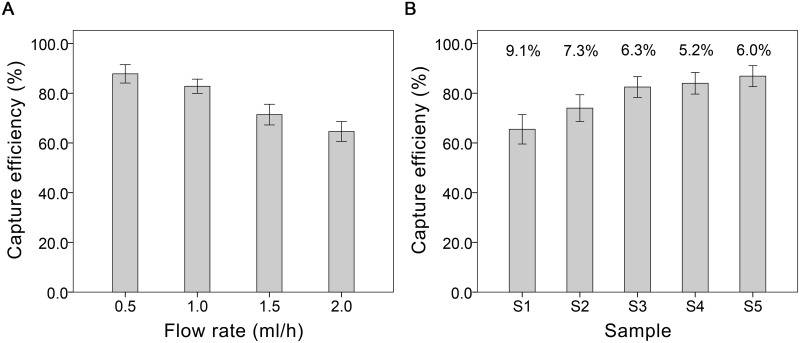
Fig 2. Parameters characterization of the microfluidic chip.
The CE values were presented as mean (SD) of five repeat tests and the intra-assay variability was presented as the CV value of eight duplicates. (A) Capture efficiency test. The CE values were 87.8% (3.7%), 82.8% (2.9%), 71.4% (4.2%) and 64.6% (4.0%) at a concentration of 100 HUVECs/ml corresponding to each flow rate. (B) Intra-assay variability analysis. In five HUVEC-spiked samples (S1-5), the concentrations of spiked-HUVECs were 10±3, 25±8, 50±14, 100±23 and 200±34 cells/ml, respectively. The CV values were 9.1% (S1), 7.3% (S2), 6.3% (S3), 5.2% (S4) and 6.0% (S5), respectively, tested at a flow rate of 1ml/h.

