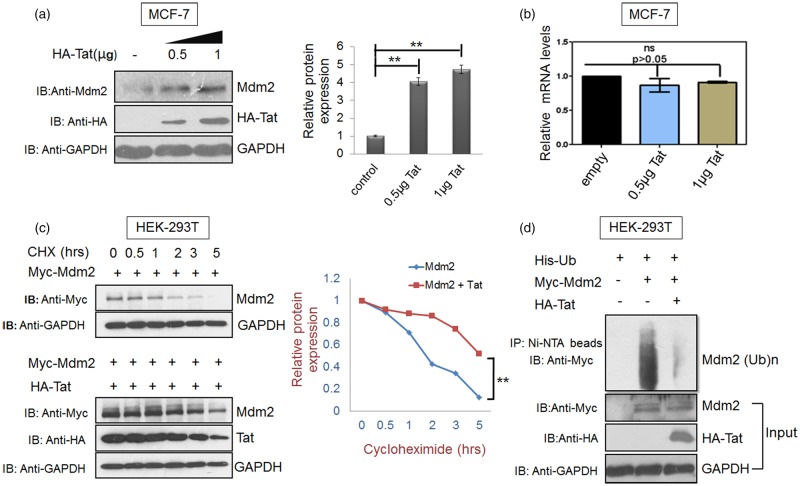
Figure 2. Tat increases Mdm2 levels at the post-translational level.
(a) MCF-7 cells were transfected with 0.5 µg and 1 µg HA-Tat and pcDNA 3.1 was used as a control DNA to normalise DNA concentration. Total Mdm2 was detected by western blot analysis. GAPDH was used as a loading control. Bar diagrams represent the protein quantitation of the respective western blots using Image J software. (b) In parallel, cells were analysed by real-time qPCR as described in the methods section. Mean value and standard deviation were calculated from 2dCt of three independent experiments. P-values were calculated by a two-tailed t-test (*P < 0.05, **P < 0.01; ns, not-significant). (c) HEK-293T cells were transfected with 2 µg of p-CMV-Myc3-Mdm2 either alone or in presence of Tat (1 µg). After 36 h of transfection, cycloheximide chase assay (CHX 100 µg/ml) was performed for 5 h to assess the half-life of Mdm2 in the presence or absence of HA-Tat. (d) HEK-293T cells were co-transfected with His-Ubiquitin (His-Ub) and either with Myc-Mdm2 alone or Myc-Mdm2 along with Myc-Tat. After 36 h, the cells were treated with MG132 for 8 h followed by lysis in denaturation buffer. Total ubiquitinated proteins were then pulled down using Ni-NTA beads and Mdm2 ubiquitination was assessed by western blot analysis with anti-Myc antibody. Bar diagrams represent the protein quantitation of respective western blots using Image J software. Data presented are representative (mean ± s.e.m.) of three independent experiments. P-values were calculated by a two-tailed t-test (*P < 0.05, **P < 0.01; ns, not significant).

