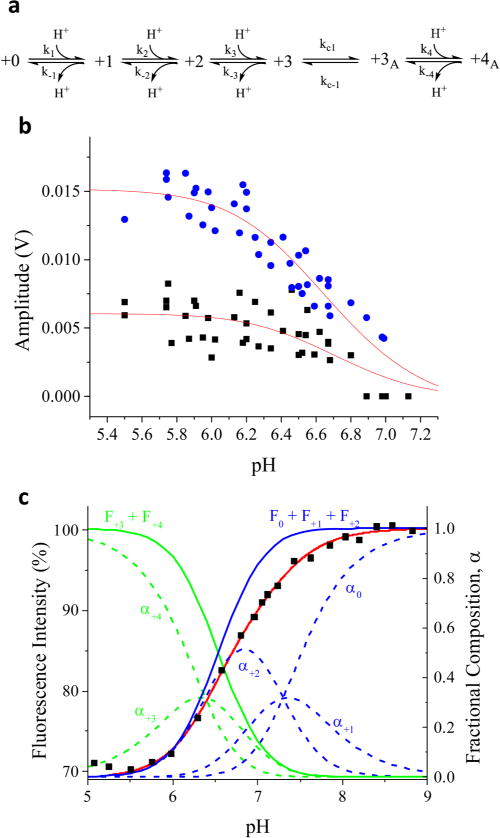
Figure 4.

Kinetic resolution of multistep protonation of M2TM. (a) Reaction scheme for progressive protonation and conformational change of M2TM. (b) Fluorescence amplitude change of k1app (circles) and k2app (squares) for M2TM in DPPC bicelles measured by pH jumps from an initial pH 7.5, as a function of final pH at 25 °C. (c) Steady-state pH dependent M2TM fluorescence intensity change (squares) along with the fit (red line) based on the polyprotic model shown in part a, with fluorescence intensities of 100% for 0 state, 95% for +1 state, 90% for +2 state, 75% for +3 state, and 70% for +4 state. The fraction of each protonation state of M2TM (dashed lines) was also calculated from the pKa values obtained from this model.
