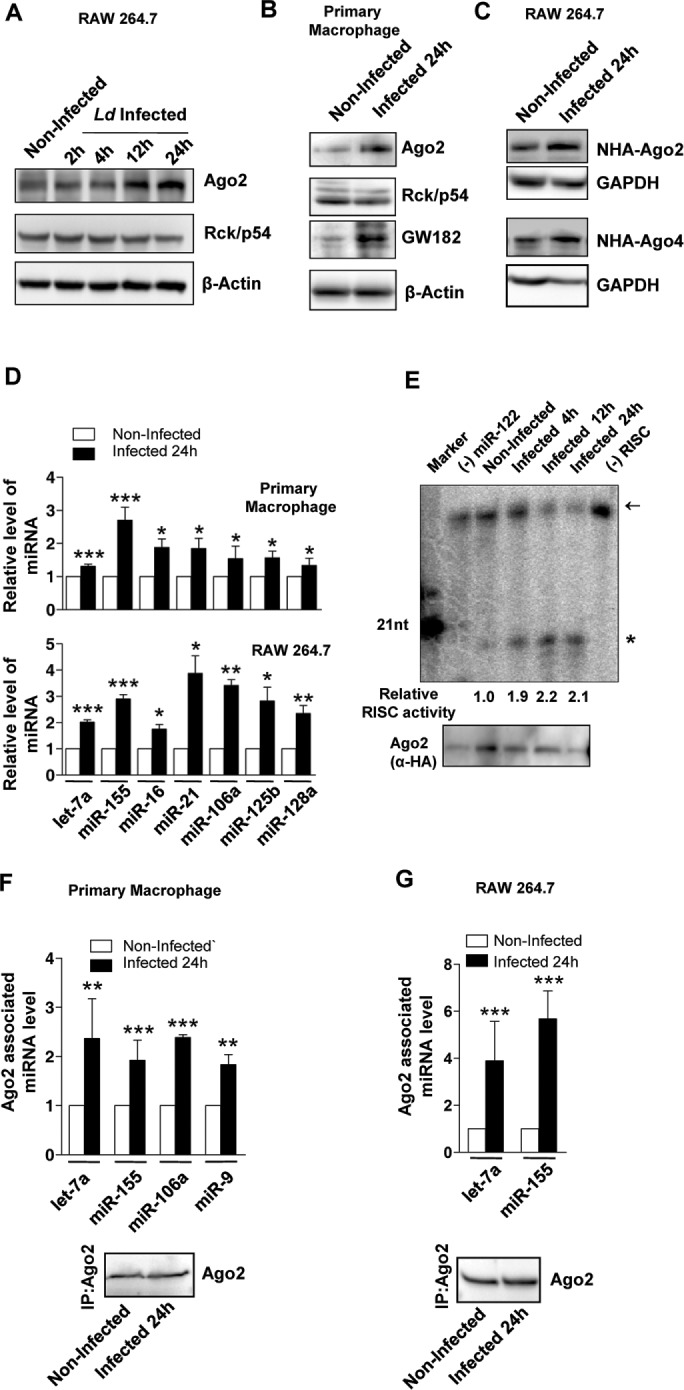
FIGURE 1:

Increased level and activity of miRNPs in Ld-infected mammalian macrophages. (A, B) Representative images of Western blot analysis for indicated proteins in noninfected and Ld-infected cells at different times postinfection. β-Actin served as loading control. (C) Representative Western blot analysis of exogenously expressed Agos in noninfected and Ld-infected RAW 264.7 cells. Cells were infected for 24 h, and GAPDH served as loading control. (D) qRT-PCR–based relative quantification of endogenous miRNA levels on Ld infection in murine primary macrophage and RAW264.7 cells. Values were normalized against respective miRNA levels in noninfected cells. Mean and SEM from at least four independent experiments. (E) Representative autoradiogram showing variation in RISC cleavage activity associated with Ago2 isolated from naive and Ld-infected cells. In vitro RISC cleavage assay was done with isolated Ago2-miR-122 miRNPs from naive and infected RAW264.7 cells cotransfected with FH-Ago2 expression construct and a miR-122 expression plasmid, pmiR-122. The activities were measured and quantified in an in vitro RISC cleavage reaction using 5′-32P–labeled miR-122 target RNA as substrate. Values below the blot indicate relative RISC activity measured by estimating the cleaved band intensities against total (uncleaved + cleaved) intensity using densitometric analysis. Intensities were normalized to immunoprecipitated (IPed) FH-Ago2 levels. Asterisk indicates cleaved product. The arrow indicates uncleaved substrate. A 21-nucleotide-long, radiolabeled DNA oligo was used as size marker. Assay done with RISC isolated from cells not expressing miR-122 is designated as (−) miR-122, and assay carried out without added RISC is denoted as (−) RISC. Bottom, immunoprecipitated FH-Ago2 levels. The FH-Ago2 band intensities from this Western blot were used for calculating RISC cleavage activity per unit Ago2 or specific activity of miRISC, as given by the respective quantified values. (F, G) IP of endogenous Ago2 was performed in noninfected and 24-h Ld-infected cells. Changes in Ago2-associated miRNA levels on Ld infection in murine primary macrophage (F) and RAW264.7 cells (G). Quantification was done by qRT-PCR–based estimation. Values were normalized against amount of Ago2 immunoprecipitated and plotted against values of noninfected samples considered as unity. Representative blots showing immunoprecipitated endogenous Ago2 level used for normalization of respective miRNA levels. Mean and SEM from at least four independent experiments. All experiments were performed with Ld-infected RAW 264.7 or murine primary macrophage cells for indicated time. p values are calculated by Student’s t test; *p < 0.05, **p < 0.01, and ***p < 0.001.
