FIGURE 2:
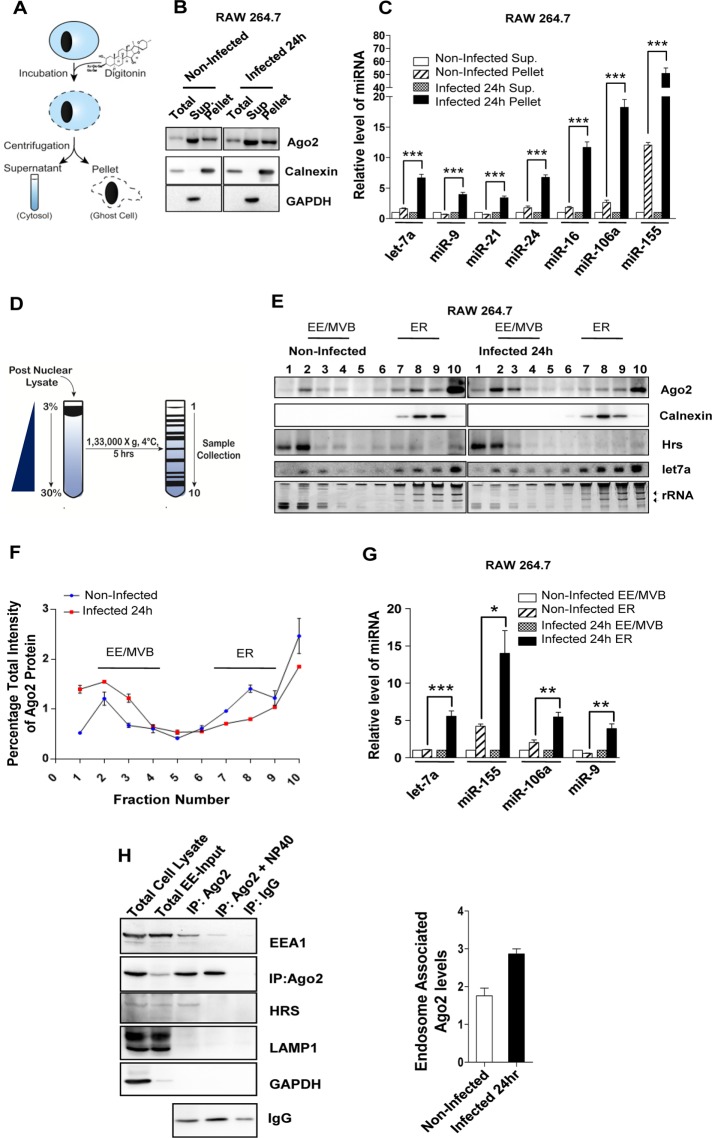
Differential distribution of miRNAs and Ago2 between ER and endosomal compartments in Ld-infected macrophages. (A) The fractionation process to get the digitonin-soluble supernatant (Sup.) and digitonin-insoluble (Pellet) fractions described in B and C. (B) Representative Western blot analysis of indicated proteins in digitonin-fractionated, Ld-infected and noninfected RAW 264.7 cells. Calnexin was used as membrane marker, and GAPDH served as cytosolic marker protein. (C) Quantitative estimation of relative miRNA level in membrane-enriched, digitonin-insoluble pellet fraction with respect to digitonin-soluble supernatant enriched for cytosolic components in noninfected and Ld-infected RAW 264.7 cells. Changes in miRNA content of individual pellet fraction are normalized against corresponding levels of miRNA in the supernatant. Mean and SEM from at least four independent experiments. (D) Procedure used to separate cellular organelles using iodixanol-based 3–30% OptiPrep gradients E–G. (E) Isotonic extracts of noninfected and Ld-infected cells were analyzed on an OptiPrep gradient (3–30%). Representative Western blots of indicated proteins were done with individual fractions. Ethidium bromide (EtBr)–stained RNA gel and Northern blot was used for detection of total RNA and let-7a miRNA, respectively. Position of ribosomal RNAs on EtBr-stained RNA gel is marked by arrows. (F) Levels of Ago2 (quantified by densitometry) in individual fractions of the OptiPrep gradients in E. Data were from more than two different experiments. Ago2 levels in individual fractions are normalized against the total Ago2 band intensity present in all the fractions. The resultant values are fitted on a scale of 0–10, where 10 indicates the sum of Ago2 density for all the fractions of an individual experiment. (G) Relative enrichment of miRNA in fractions enriched for ER or EE after Ld infection. Fractions 2–4 and 7–9 of OptiPrep gradients described in E were used for estimation of EE- and ER-associated RNA, respectively. The ER fraction from each set was normalized against corresponding EE levels. Mean and SEM from at least three independent experiments. (H) Membrane IP for endogenous Ago2 from reisolated endosomal-enriched fractions 2–4 of 3–30% OptiPrep gradient. Left, Presence of indicated proteins is shown by western blot in E. Total cell lysate is the postnuclear fraction from RAW 264.7 cells used for loading on the 3–30% OptiPrep gradient. Total EE-Input indicates the reisolated EE fraction used for IP. IgG immunoprecipitation was used as negative control to estimate nonspecific binding. NP-40 was used in the IP reaction to confirm the indirect interaction (organelle mediated) between Ago2 and EEA1. The IgG large fragment level was used to show effective IP reaction. Right, Estimation of endosomal membrane–interacting endogenous Ago2 with reisolated endosomes as described in H for RAW 264.7 macrophages infected with Ld. Densitometric analysis and relative quantification for both Ago2 and EEA1 band intensities from two different experiments are plotted. Experiments were performed with Ld -infected cells for indicated times. p values are calculated by Student’s t test; *p < 0.05, **p < 0.01, and ***p < 0.001.

