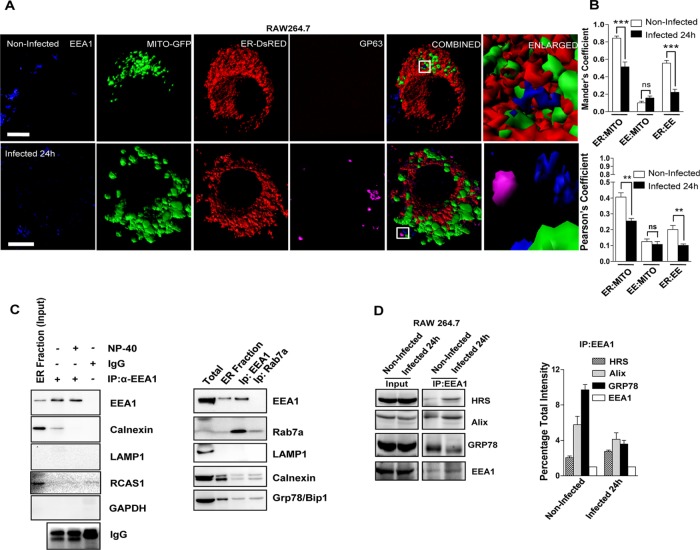
FIGURE 3:
Altered ER–mitochondria and ER–endosome interaction in Ld-infected cells. (A) Representative frames with 3D surface reconstructions of ER-, EE-, and GP63-positive structures and mitochondria in noninfected and Ld-infected RAW264.7 cells. Cells expressing a mitochondrial-targeting variant of GFP (MT-GFP, green) and an ER-targeting variant of DsRed (pDsRed2-ER, red) were stained for endogenous EEA-1 (blue) marking the endosomal membranes. Ld was detected by indirect fluorescence against GP63 (magenta), an Ld-specific membrane protein. Right, boxed areas 10× zoomed. Scale bars, 10 μm. (B) Mean ± SEM from at least four independent experiments (10 cells/experiment) of interaction data for ER–mitochondria, mitochondria–EE, and ER-EE as in A. Manders and Pearson coefficients were used to depict the colocalization between organelles under consideration. (C) Representative picture of Western blot analysis of organelle-immunoprecipitated materials from the extract of 24-h Ld-infected RAW 264.7 cells. EEA1 was pulled down from reisolated ER-enriched fractions (7–9) of 3–30% OptiPrep gradient of infected cells for indicated proteins. Reisolated ER fraction was used for IP. IgG pull down is used as negative control to estimate nonspecific binding. NP-40 treatment reduces the amount of immunoprecipitated EEA1-associated calnexin and was used to confirm the indirect (organelle-level) interaction between EEA1 and calnexin. Right, in similar reaction to that with EEA1, Rab7-positive organelles were also isolated to confirm the absence of contaminating vesicles such as lysosomes positive for LAMP1. RCAS1 is used as Golgi body marker. Presence of GRP78, a luminal protein, confirms the association of intact ER with either EEA1- or LAMP1-positive organelles. (D) EEA1 immunoisolation from isotonic cell lysate was done from naive or Ld-infected RAW264.7 cells as labeled. For the quantification, the densitometric estimation of immunoisolated proteins from two independent experiments was plotted, with coimmunoprecipitated protein levels normalized against the level of immunoprecipitated EEA1 levels. For B, p values were calculated by Student’s t test; *p < 0.05, **p < 0.01, and ***p < 0.001.

