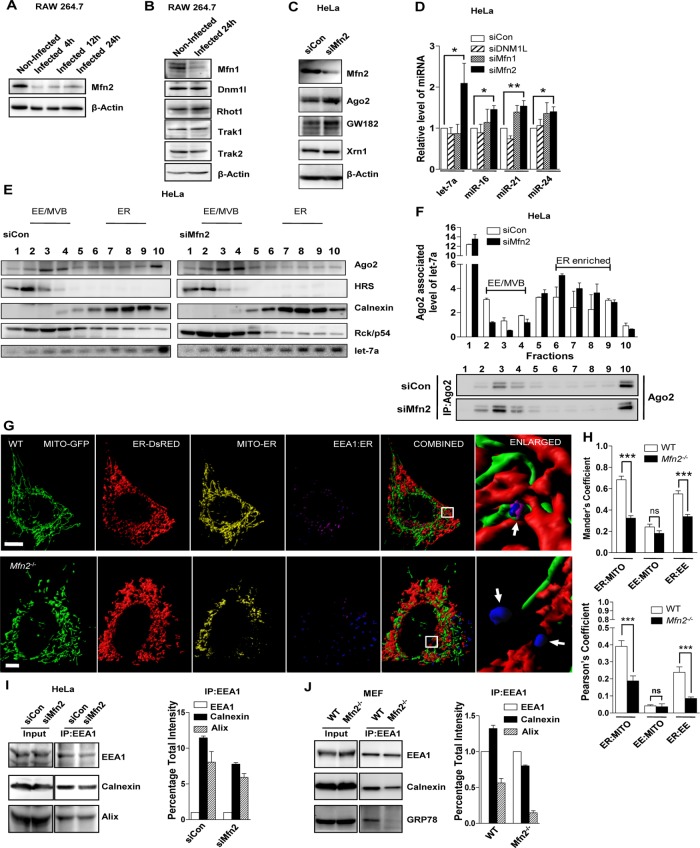
FIGURE 6:
Loss of Mfn2 causes reduction in ER–endosome interaction and enhances accumulation of miRNPs on ER. (A, B) Representative blots indicating expression of Mfn2 in RAW164.7 cells infected with Ld for indicated time (A). Changes in the expression of other relevant factors were also done in 24-h–infected cells (B). β-Actin served as loading control. (C) Representative Western blot analysis of indicated proteins in HeLa cells transfected with siRNAs against Mfn2. siControl (siCon)-transfected cells were used as control. β-Actin level served as loading control. (D) Real-time quantification of miRNAs in HeLa cells transfected with specific siRNAs or siControl. Values were normalized to corresponding level of miRNAs in siControl (siCon)-transfected cells. Mean and SEM from at least three independent experiments. (E) Representative Western blot analysis of indicated proteins and Northern blotting of let-7a with fractions obtained from OptiPrep gradient (3–30%) of extracts from HeLa cells transfected with either control or Mfn2-specific siRNAs. Positions of the individual fractions enriched for different organelles as shown above. (F) Subcellular distribution of Ago2-associated endogenous let-7a in individual fractions of OptiPrep gradient as described in E. The let-7a associated with immunoprecipitated Ago2 was measured in individual fractions, normalized against immunoprecipitated Ago2 levels, and plotted. Representative Western blot depicting immunoprecipitated levels of endogenous Ago2 used for normalization of let-7a in corresponding fractions of the OptiPrep gradient. (G) Representative 3D surface reconstructions of ER, EE, and mitochondria in MEFs of indicated genotype. Cells were cotransfected with pDsRed2-ER (red) and pAcGFP1-Mito (green) plasmids. EE is labeled with endogenous EEA-1 (blue). Magenta indicates reconstructions of colocalization surface between ER and EE (Coloc. Surf.EE-ER). Yellow indicates colocalization of mitochondria with ER. Scale bars, 10 μm. Right, boxed areas 10× zoomed. Arrows depict relative EE–ER localization. (H) Mean and SEM from at least three independent experiments (15 cells/experiment) of interaction data for ER–mitochondria, mitochondria–EE, and ER–EE. Manders and Pearson’s coefficients were used to indicate the colocalization between different organelles. (I, J) Representative Western blot analysis of indicated proteins from membrane-immunoprecipitated samples. EEA-1 was pulled down from whole-cell lysate from different cell types. Knockdown of Mfn2 was achieved by siRNA specific to Mfn2, and control siRNA (siCon)-transfected cells were used as control (I). Wild-type or Mfn−/− MEFs were used in experiments. (J) Densitometric quantification of Western blot data was used to calculate the relative change in association between the organellar markers. Error bars indicate mean ± SEM (n ≥ 3). p values were calculated by Student’s t test; *p < 0.05, **p < 0.01, and ***p < 0.001.

