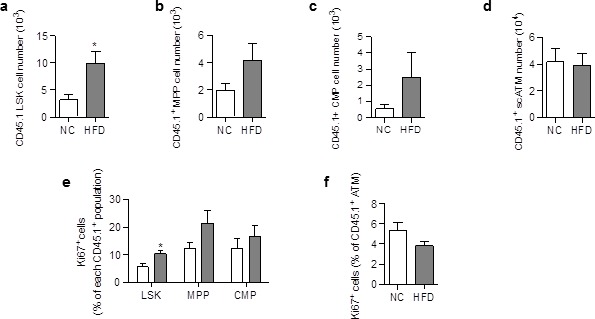
Figure 2. ATM accumulation in the scAT of HFD mice is due to enhanced proliferation of myeloid progenitors at the onset of the disease.
Flow cytometry was performed on SVF cells from mice fed a NC or a HFD for 3 to 6 days, to identify myeloid progenitors and ATM. Quantification of LSK cells (a); Lin−/Sca-1+/c-Kit+), Multipotent Progenitors (b); MPP; Lin−/Sca-1+/c-Kit+/CD34+); Common Myeloid Progenitors (c); CMP; Lin-/Sca-1−/c-Kit+/CD34+) and ATM (d); MHCII+/F4/80+) within the CD45.1+ population, expressed in absolute numbers. Proliferation was assessed by Ki67 staining in CD45.1+ LSK and myeloid progenitors (e) as well as in CD45.1+ ATM (f), and expressed as percent of each CD45.1+ population. Results are expressed as mean ± sem of 4 to 8 individual animals in control (white symbols) and HFD (grey symbols) groups. Comparisons between groups were made with the nonparametric Mann-Whitney test. *p<0.05.

Figure 2—figure supplement 1. Differentiation and proliferation of ATM are unchanged in the scAT of chimeric mice after 3 months of HFD.

