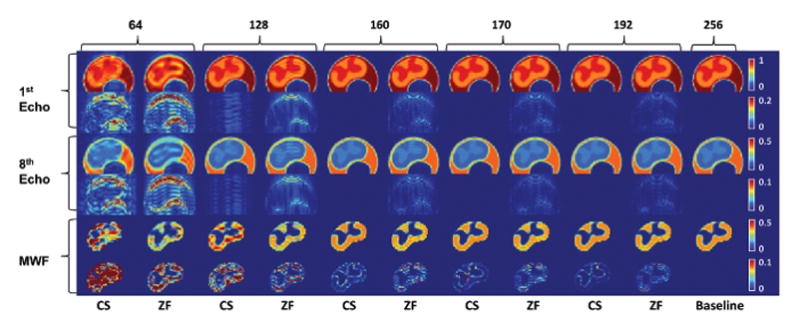
Figure 2. Reconstruction results from simulated undersampling of the electronic phantom.

First and third row shows the first and eighth T2-weighted echo image, followed by the absolute difference map against the baseline T2-weighted echo image (far right column) in second and fourth row. Fifth row shows the generated myelin water fraction (MWF) map followed by the absolute difference map against the baseline MWF map (far right). Odd number columns are CS reconstructed images; even columns are zero-filled (ZF) reconstructions of equivalent phase encode lines at the central k-space. Numbers indicate the phase encode lines used. Far right column is the fully sampled baseline image.
