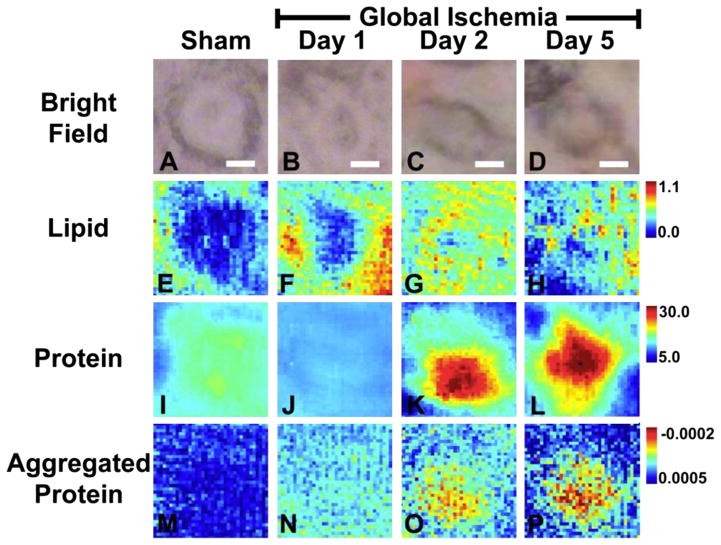
Fig. 5.
Macromolecule levels in representative single CA1 neurons following global ischemia visualized with multi-beam FTIRI. Multi-beam FTIRI was used to validate the results from single beam FTIRI. (A, E, I, M) sham animal, (B, F, J, N) animal 1 day after global ischemia, (C, G, K, O) animal 2 days after global ischemia (D, H, L, P) animal 5 days after global ischemia. (A–D) Visible light microscopy of the same neurons analyzed with FTIRI. The soma of neurons 2 days and 5 days after global ischemia was substantially darker than in the sham animal or animal 1 day after ischemia. Supporting Information Fig. 2 demonstrates that darkened soma observed on visible light microscopy of unstained tissue correlates with eosinophilic cells in H&E stained tissue. (E–H) The lipid ester distribution (integrated band area 1755–1720 cm−1), which was used to visualize neuron morphology in sham animals and animals 1 day after global ischemia. (I–L) Total protein levels, showing a significant decrease in total protein 1 day after global ischemia and a large increase in total protein 2 days and 5 days after ischemia (See Table 1). (M–P) Relative levels of aggregated proteins, showing an increasing trend for protein aggregation with time following ischemic insult. Scale bar=5 μm. Units for the intensity scale are arbitrary absorbance units.

