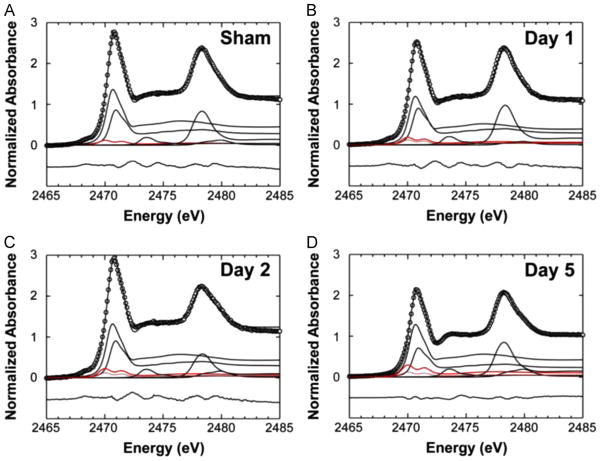
Fig. 7.
Linear fitting of micro-XAS spectra at the sulfur K-edge to reveal the disulfide contribution (red spectrum) in pyramidal neurons from (A) sham animals, (B) animals 1 day after global brain ischemia, (C) animals 2 days after ischemia, (D) animals 5 days after ischemia. The disulfide contribution of sham animals is also shown as a paler red-dashed line in panels B–D, to demonstrate the increase in disulfide content that occurs following ischemia.

